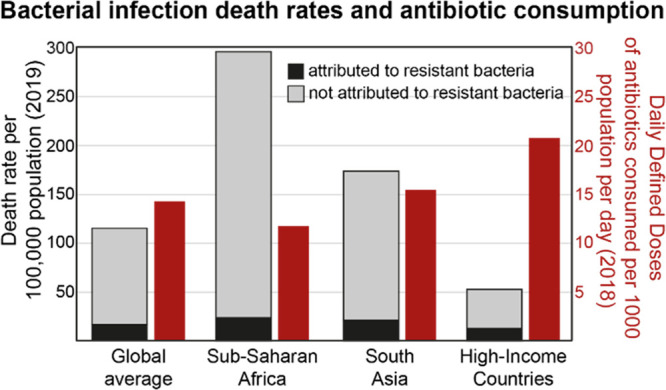
Figure 2.

Bacterial infection death rates (2019) and antibiotic consumption (2018) for various world regions. Death rates attributed to resistant bacteria (black bars) are from ref (14). Death rates not attributed to resistant bacteria (gray bars) were calculated by adding the total death rates from 33 pathogens19 to the total death rates from tuberculosis (data derived from GBD2019 and retrieved from “Our World in Data” web site),20 and subtracting the death rate attributed to resistant bacteria.18 The global total death rate from 33 pathogens is not explicitly age standardized. Antibiotic consumption rates (red bars) are from ref (13).
