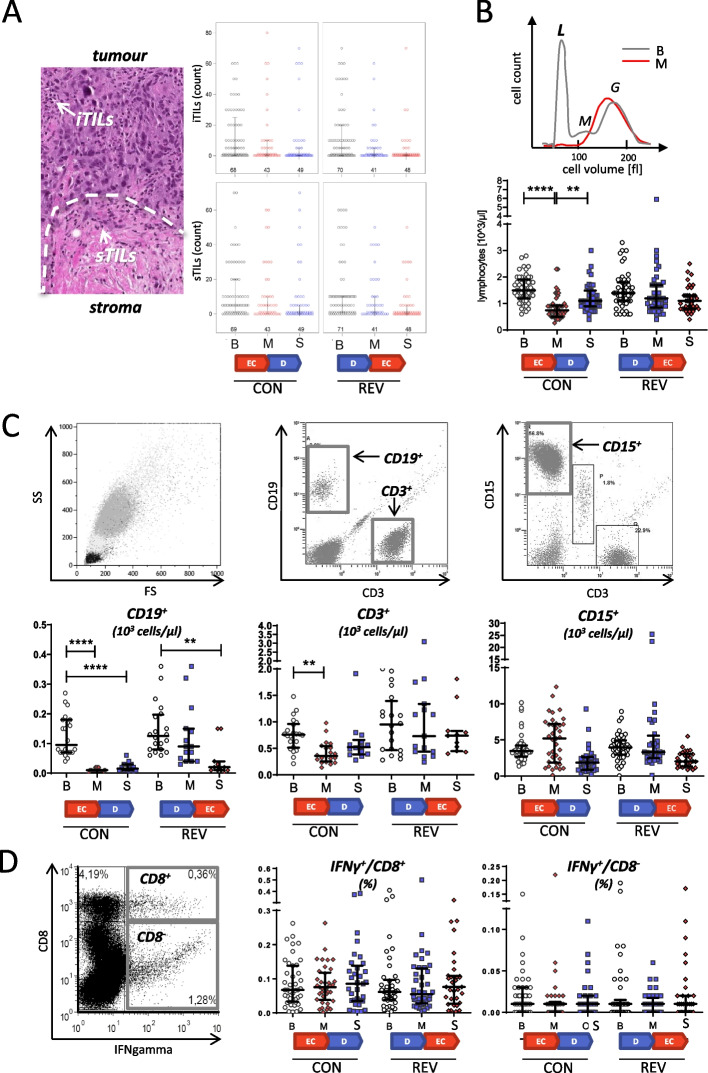
Fig. 2.
Effect of NAC on lymphocyte count and function. Tumor tissues and blood samples were collected at baseline (B), mid-therapy (M), and surgery (S) from patients treated with either conventional (CON) or reverse (REV) sequence of NAC. The color indicates the therapy administered immediately prior to the respective analysis: red for EC and blue for D. The pre-treatment analysis (baseline, B) is indicated in black. A Histological quantification of intratumoral TILs (iTILs) and stromal TILs (sTILs) in tumor tissue samples. The left panel shows an H&E stained tumor tissue. The invasive margin of the tumor is indicated by a dashed line. The arrows indicate examples of TILs. The panels on the right show the quantitative analysis. B Hemocytometric analysis of blood samples: The top graph shows typical examples of such analyses in blood samples taken at baseline (B) and midterm (M) of a CON patient. The lines indicate the cell volume distribution of the WBC populations (lymphocytes, L; monocytes, M; granulocytes, G). The bottom graph summarizes the lymphocyte counts of all patients. C Flow cytometric lymphocyte subtyping: quantification of CD3+ T cells, CD19+ B cells, and CD15+ granulocytes. D Lymphocyte function: PBMCs were prepared from peripheral blood and stimulated with PHA. IFNγ+/CD8+ T cells (left) and IFNγ+/CD8− cells (right) were counted by flow cytometry. All graphs show individual patient values as well as median ± IQR. The statistical significance was calculated using a paired Student’s t-test (**… ≤ 0.01; ****… ≤ 0.001)

