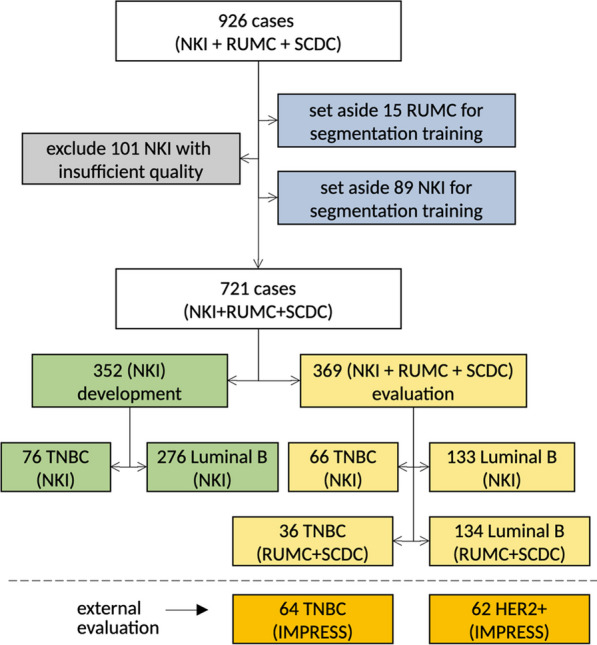
Fig. 2.

Biomarker development and evaluation data: visualization of the data split per type (TNBC, Luminal B), center (NKI, RUMC+SCDC, IMPRESS) and data subset (development, evaluation), starting from the exclusion of cases due to quality (in gray) and for training of the segmentation model (in blue, part of ) to the definition of the development (in green, ) and evaluation (in yellow, ) datasets. Shown is also the additional IMPRESS [24] evaluation data (in orange, ). Not included is the additional data for segmentation model training
