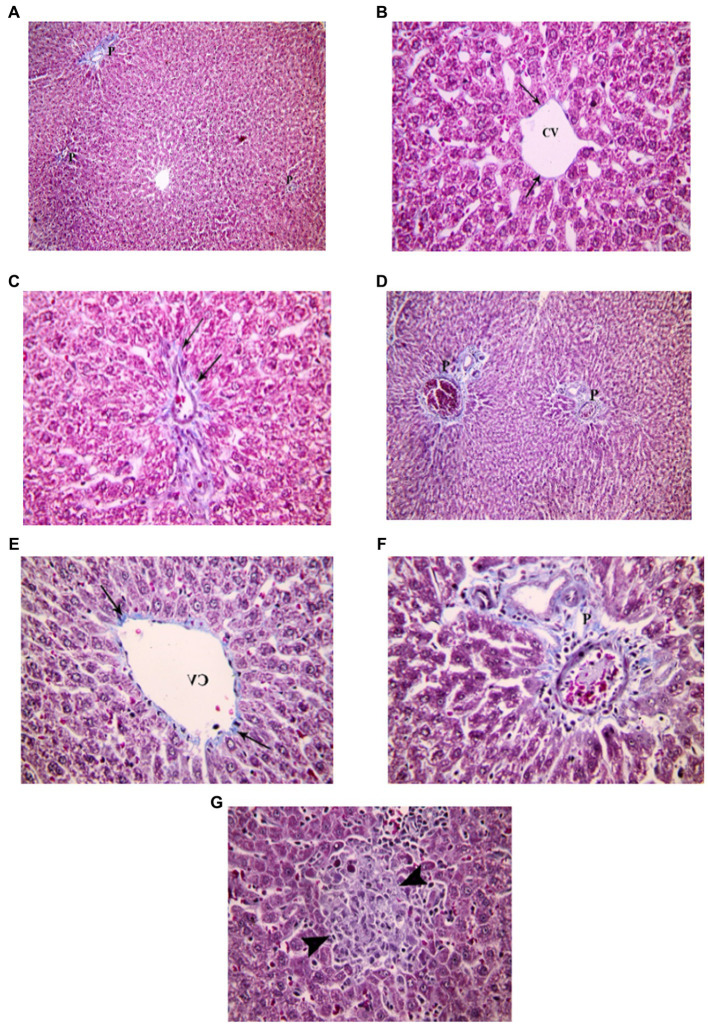
Figure 11.
Showing liver sections in adult groups. (A–C) Control. (A) Collagen fibers in portal areas (P). (B) showing thin collagen fibers (↑) around a central vein (CV). (C) Section showing few, thin collagen fibers (↑) in a portal area. (D–G) Indomethacin group. (D) Enlarged portal areas (P), with increased amount of collagen fibers. (E) Increased amount of collagen fibers (↑) around a central vein (CV). (F) Enlarged portal area (P), with increased amount of collagen fibers. (G) Focal necrosis (▴) seen within a hepatic lobule. Mallory’s trichrome stain: (A,D) × 100; (B,C,E,F,G) × 400.

