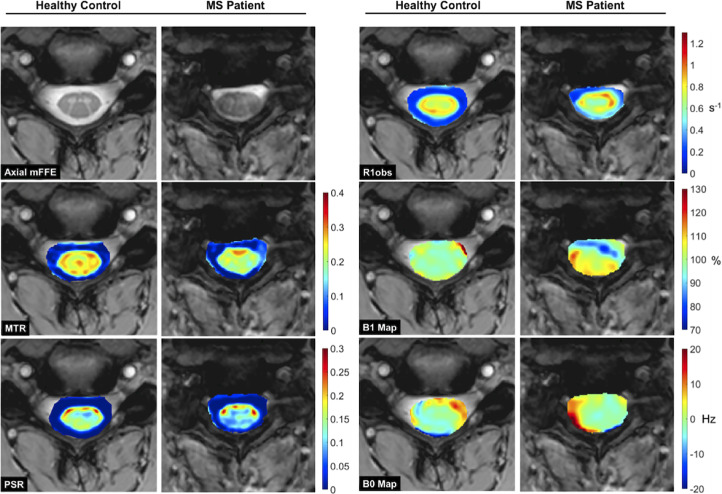
Figure 2.
Anatomical data (a), MTR (b), PSR (c), R1,obs (d), B1 map (e), and B0 map (f) for representative healthy control (left column) and MS patient (right column). Observe the decrease in the MTR and PSR within the spinal cord of the MS patient when compared to the control, accompanied by increases in the surrounding CSF.
MTR: magnetization transfer ratio; PSR: pool size ratio; MS: multiple sclerosis; CSF: cerebrospinal fluid.

