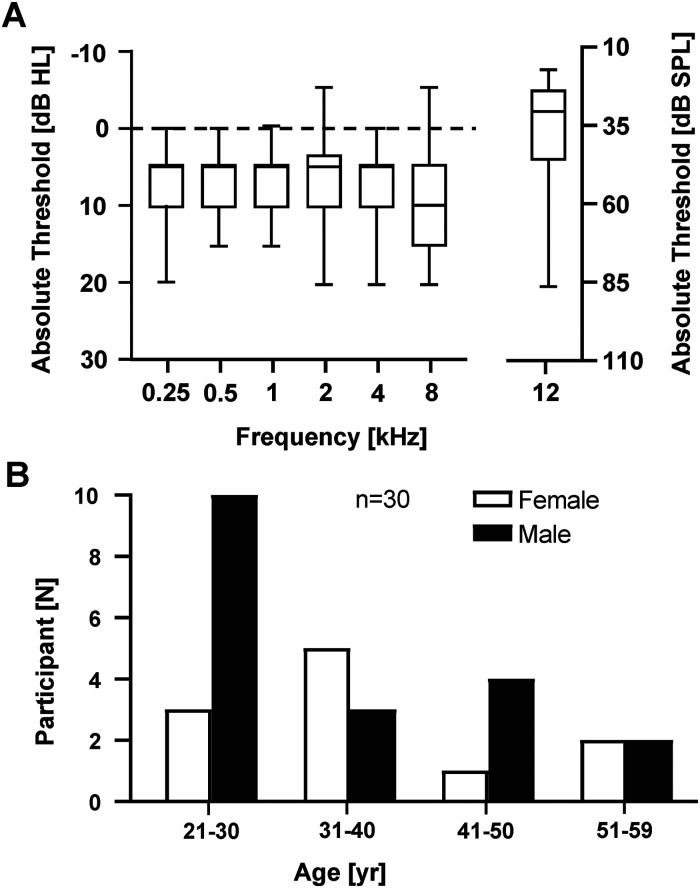
Figure 2.
(A) Audiometric air-conduction thresholds (left panel) and high-frequency (12 kHz) thresholds (right panel) for the test ear. Note the different ordinate scales in the two panels (dB HL vs. dB SPL). Boxplots indicate the minimum threshold, first (lower) quartile, median, third (upper) quartile, and maximum threshold. (B) Distributions of age for men and women participants.

