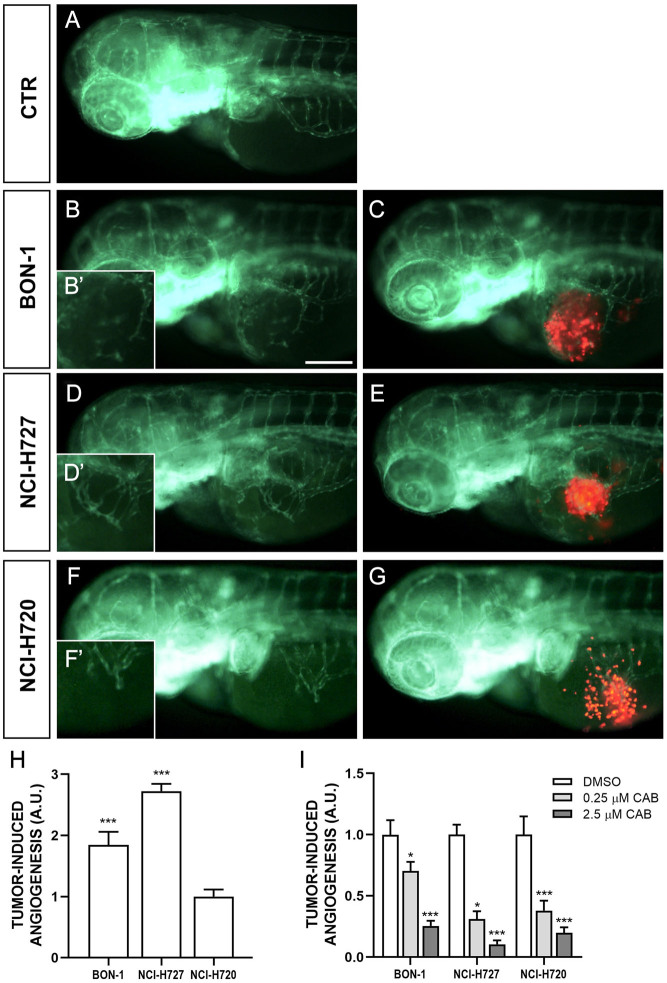
Figure 4.
Engraftment of NEN cells in zebrafish embryos. Representative epifluorescence images of Tg(fli1a:EGFP)y1 embryos injected with PBS (control; A) and implanted with red-stained BON-1 cells (B, B’ and C), NCI-H727 cells (D, D’ and E) and NCI-H720 cells (F, F’ and G). Embryos were imaged at 24 h post injection (hpi). The red channel was omitted in panels B, B’, D, D’, F and F’ to facilitate the observation of tumor-induced angiogenesis (green). NEN cells stimulated endothelial sprouting from the SIV plexus within 24 hpi. B’, D’ and F’ are the digital magnification of white-boxed regions. All images are oriented so that rostral is to the left and dorsal is at the top. Scale bar, 100 μm. The graph H showed the quantification of tumor-induced angiogenesis at 24 hpi. NCI-H720 value have been set to 1.0. The graph I showed the quantification of tumor-induced angiogenesis in embryos after 24 h of treatment with DMSO and CAB (0.25 and 2.5 µM). Control (DMSO) values have been set to 1.0. The values reported in the graphs represent the mean ± s.e.m. *P < 0.05;***P < 0.001. A full-colour version of this figure can be found at https://doi.org/10.1530/ERC-23-0232.

 This work is licensed under a