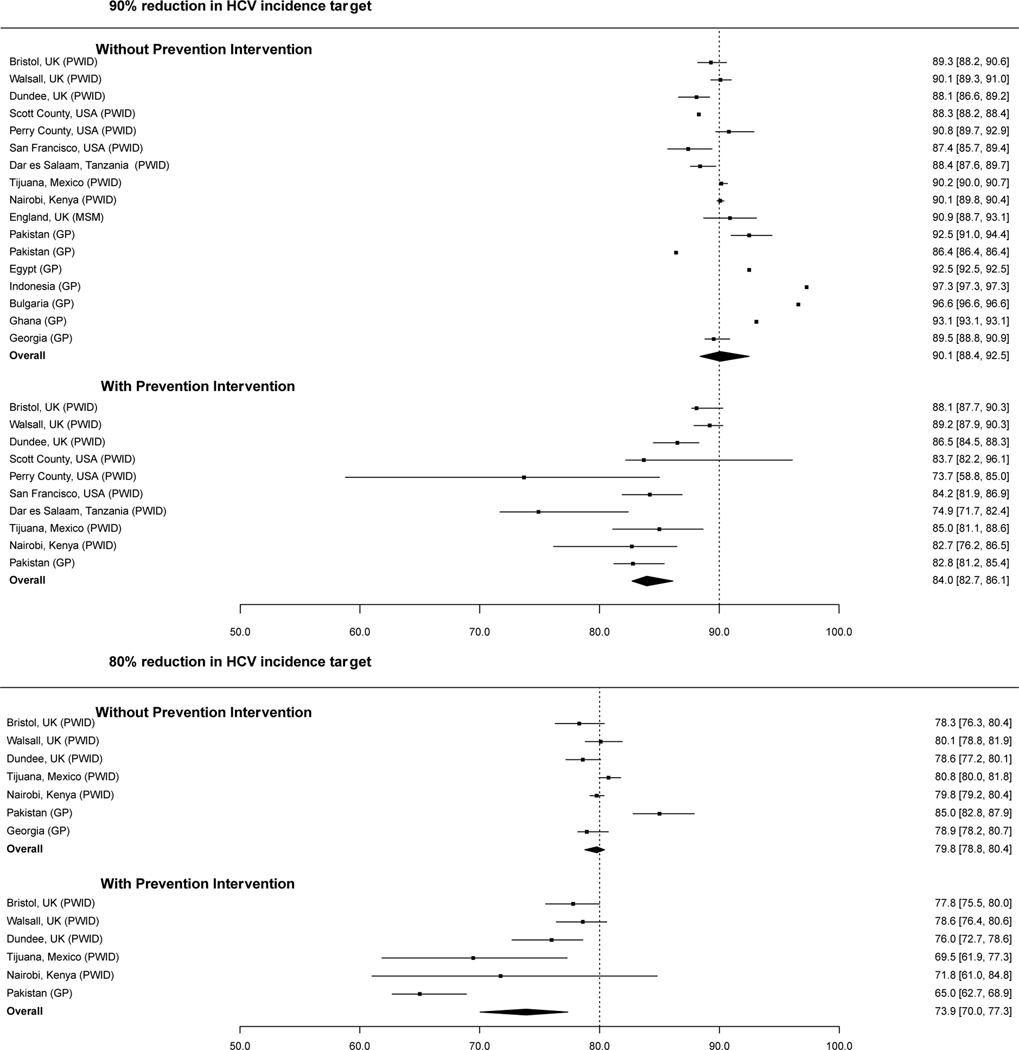
Figure 1b:
Estimated decrease (%) in chronic HCV prevalence when an 80 or 90% decrease in HCV incidence is achieved from scaling-up HCV treatment with or without the concurrent scale-up of HCV preventative interventions. Overall estimates reflect the median and interquartile range of the individual point estimates. GP denotes results from a model of HCV transmission in the general population; PWID denotes results from a model of HCV transmission among PWID; and MSM denotes results from a model of HCV transmission among MSM. In the scenarios including preventative interventions, the level of scale-up is given in Supplementary Table 1.

