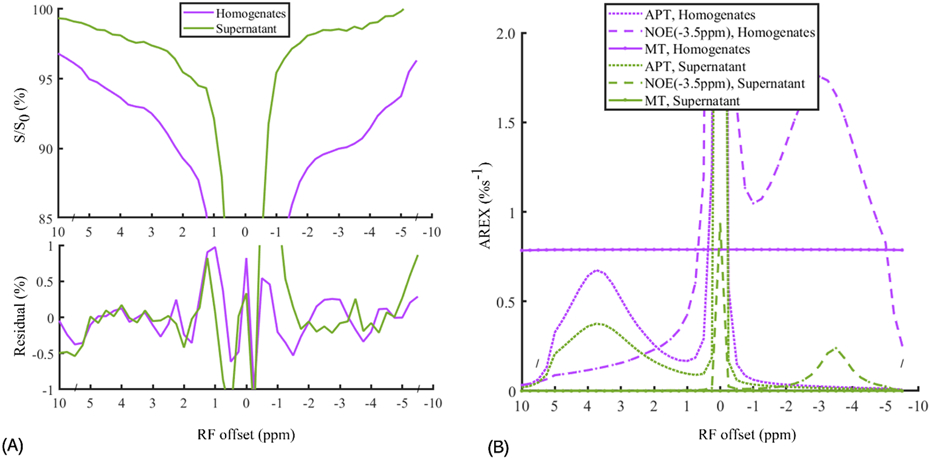
Figure 1.

CEST Z-spectra and the corresponding residual spectra (A) and AREXmfit determined APT, NOE(−3.5 ppm), and MT spectra (B) from brain tissue homogenates (purple lines) and the supernatant (green lines). Note that the AREX determined MT in the supernatant is close to 0; the relatively small residuals (< ±0.02%) at ± 3.5 ppm compared with the AREXmift determined APT and NOE(−3.5 ppm) signals indicate high goodness of the multiple-pool Lorentzian fitting.
