
Figure 4.
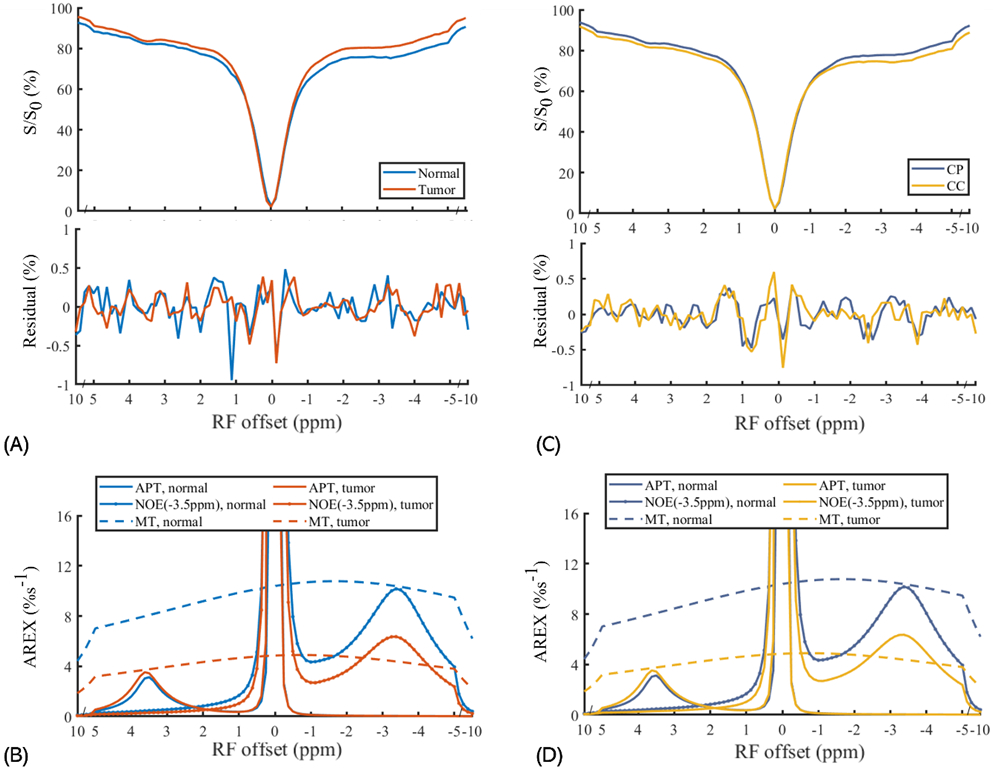
Average CEST Z-spectra and the corresponding residual spectra (A, B) and AREXmfit spectra (C, D) detected from tumors and contralateral normal tissues (left panels), and from the caudate putamen (CP) and the corpus callosum (CC) (right panels). Note that relatively small residuals (< ±0.02%) at ±3.5ppm compared with the AREXmift determined APT and NOE(−3.5 ppm) signals indicate high goodness of the multiple-pool Lorentzian fitting.