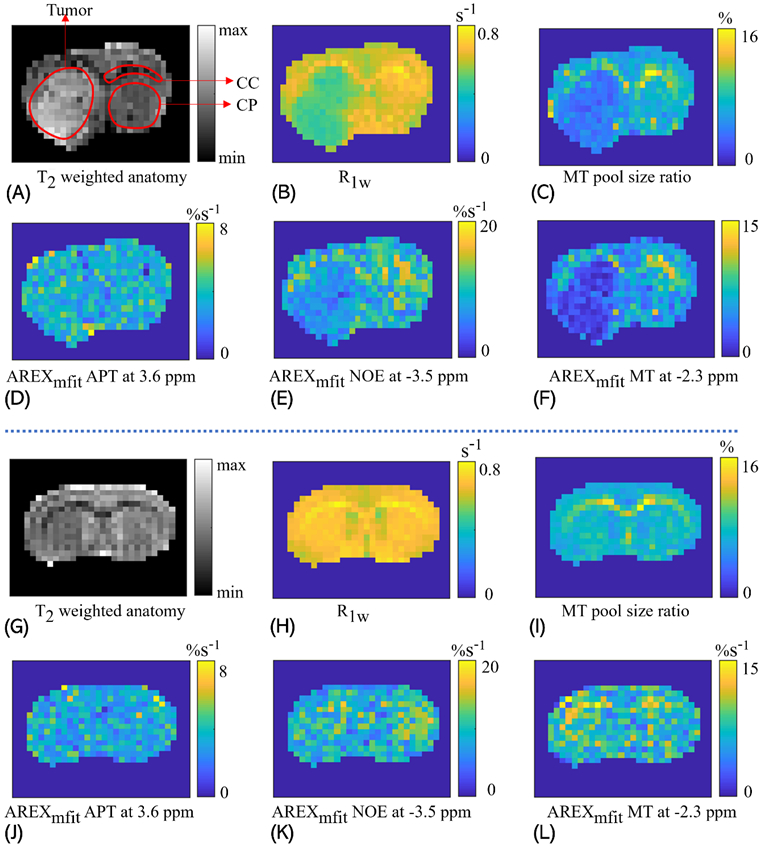
Figure 5.

Maps of T2 weighted anatomy (A, G), R1w (B, H), MT pool size ratio (C, I), AREXmfit for APT at 3.6ppm (D, J), AREXmfit for NOE(−3.5 ppm) at −3.5ppm (E, K), and AREXmfit for MT at −2.3ppm (F, L), from the brain of a representative rat that bears 9L tumors (A-F) and a representative healthy rat (G-L). In the T2 weighted image, the tumor tissues, the caudate putamen (CP) and the corpus callosum (CC) are delineated by red lines.
