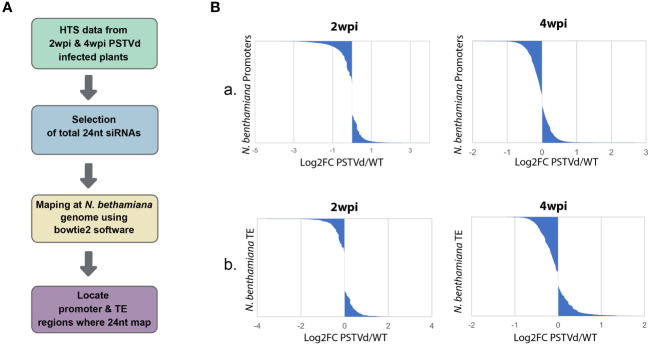
Figure 1.
Mapping of the 24nt siRNAs population from non-infected and PSTVd infected N. benthamiana plants in the promoter and TE regions. (A) Schematic representation of the used bioinformatic pipeline (B) Graphical representations of the mapped 24 nt siRNAs of WT versus PSTVd-infected plants in promoter region (A) and TE (B) at 2 wpi and 4 wpi (details in Table S1 ).

