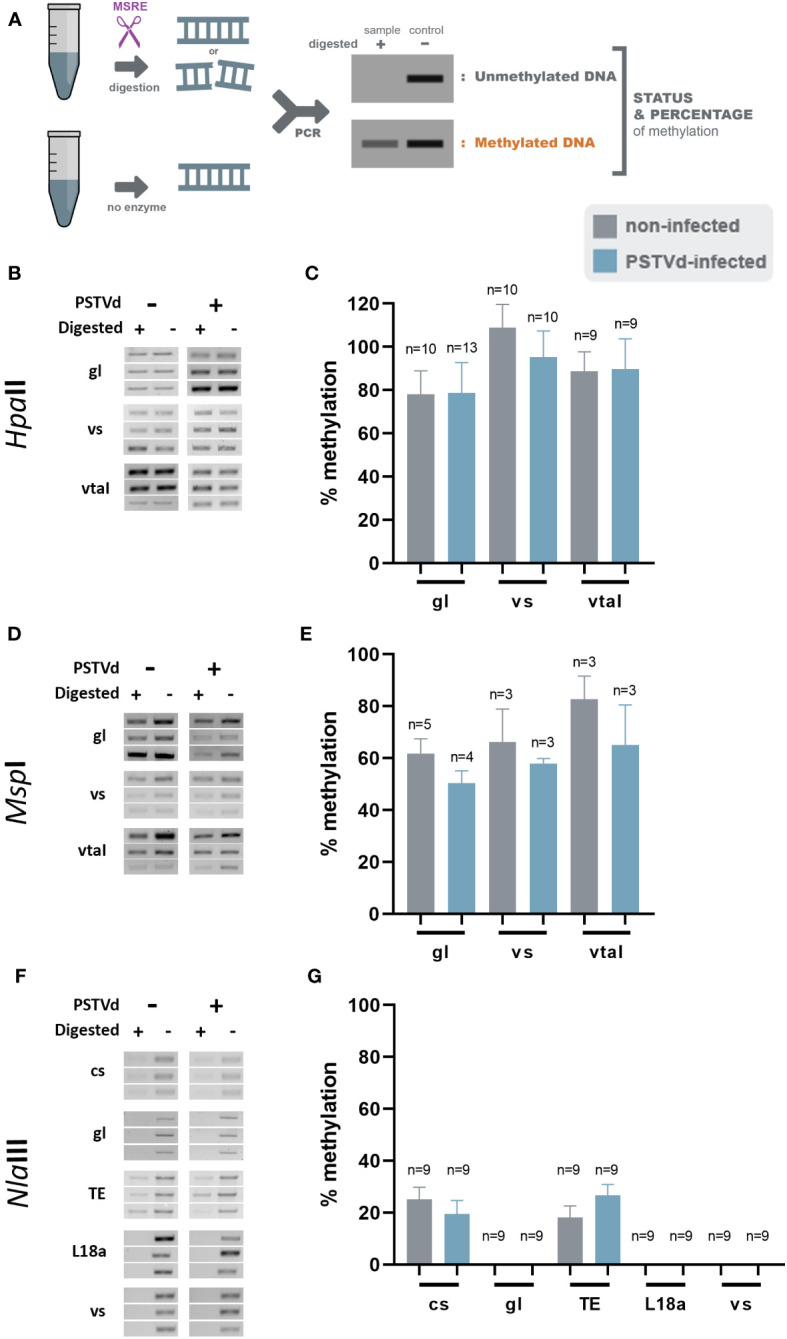
Figure 3.

HpaII, MspI and NlaIII digestions in non-infected and PSTVd-infected plants. (A) Schematic representation of the digestion pattern and result obtain during MRSE digestions. All used enzymes cut unmethylated DNA, therefore a band is expected after PCR if methylation occurs. Three biological and three technical repeats were performed (one presented here and two in Figure S3 ) using HpaII (B), MspI (D) and NlaIII (F), for promoter region of germin-like (gl), vironine synthase (vs), vacuolar protein sorting - associated protein (vtaI), cellulose synthase (cs), ribosomal L18a (L18a), glucan endo 1-3 beta – glucosidase (1-3 beta).and TE. (C, E, G) Graphical representation of chop PCRs measurements, respectively. ‘n’ represents the number of calculated replicates from all biological and technical repeats.
