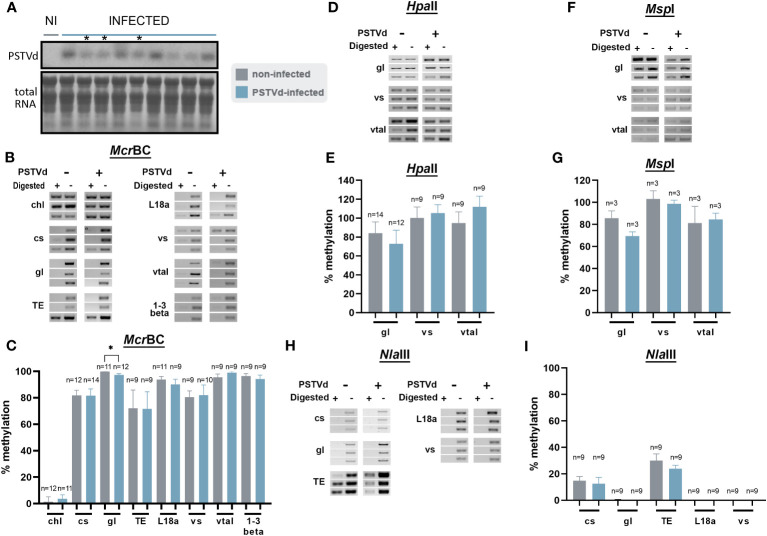
Figure 5.
Chop-PCR in non-infected and PSTVd-infected DCL3.10i N. benthamiana plants. (A) Northern blot analysis of DCL3.10i and PSTVd infected N. benthamiana plants (3wpi). Total RNA identified with methylene blue was used as a loading control. (*) Symbolizes the infected plants that were selected. Digestion of DNA from DCL3.10i non-infected and PSTVd infected plants with McrBC (B), HpaII (D), MspI (F), NlaIII (H), in triplicates of one biological repeat. Two more are present in Figure S4 . Used targets were a control DNA (chl), promoter region of cellulose synthase (cs), germin-like (gl), TE, ribosomal L18a (L18a), vironine synthase (vs), vacuolar protein sorting - associated protein (vtaI) and glucan endo 1-3 beta – glucosidase (1-3 beta). (C, E, G) and (I) Graphical representation of chop PCRs measurements. ‘n’ represents the number of analyzed samples from all biological and technical repeats. Results were analyzed with unpaired Student t-test, with level of significance set at p< 0.05 and symbolized with (*).

