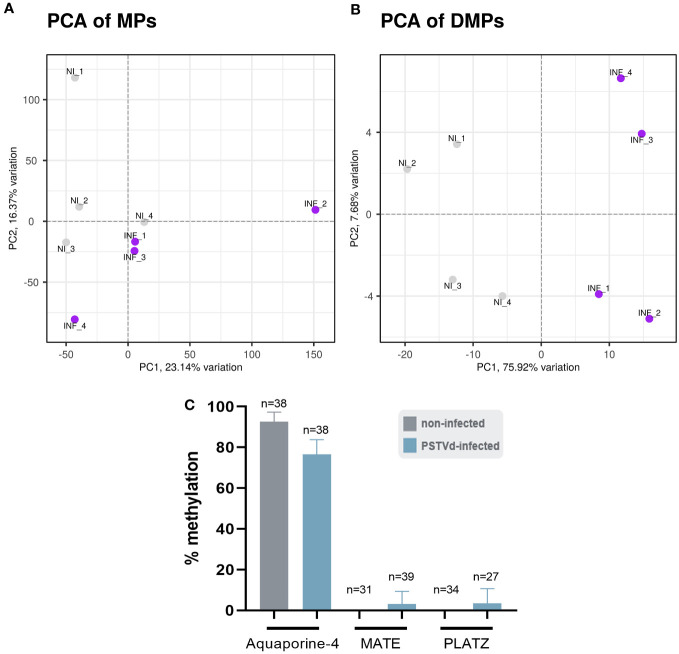
Figure 7.
Principal component analysis (PCA). A difference in the clustering of analyzed samples was observed between non-infected (NI) and PSTVd infected plants (INF) as shown by (A) PCA for Methylated Positions (MP) and (B) PCA for Differentially Methylated Positions (DMP). (C) Bisulfite sequencing analysis for bioinformatic pipeline verification. Three promoter targets were chosen, Aquaporine-4, MATE and PLATZ. ‘n’ represents the number of sequenced clones analyzed.

