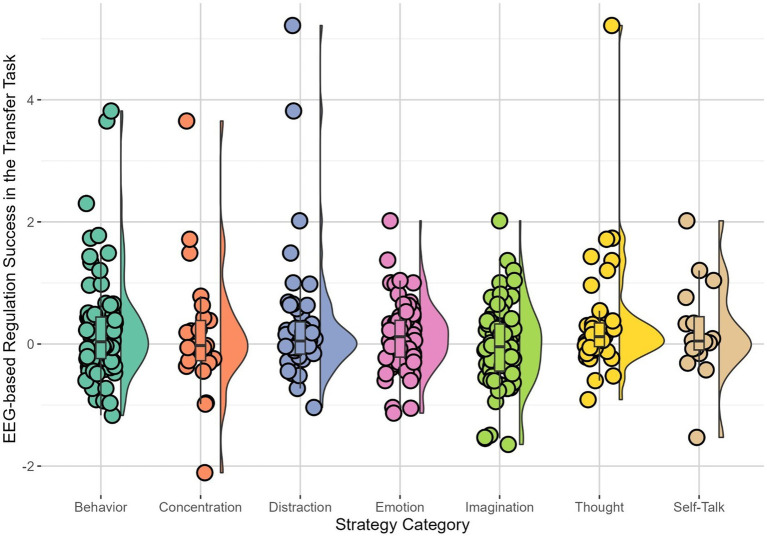
Figure 2.
Patients’ (n = 23) brain-based success in the transfer task without immediate feedback for each strategy. Each dot showed the observed brain-based success, defined by the difference in high beta amplitude between regulation and baseline in the transfer task, when using the respective strategy. Horizontal lines indicated the median, whiskers indicated the first and third quartiles. The shape illustrates the distribution of EEG-based regulation success in the transfer task for the respective strategy. Results were averaged over sessions.

