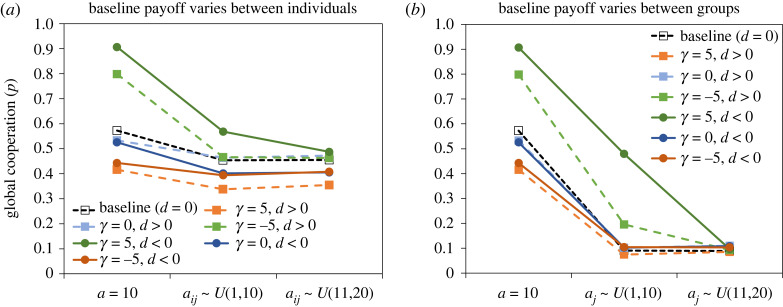
Figure 4.
The evolution of cooperation under different distributions of initial wealth. The leftmost data points in each panel represent the standard model above in which all agents receive a baseline payoff of a = 10. (a) Each agent independently draws a baseline payoff. (b) Baseline payoff varies between groups in which each individual has the same baseline payoff. As before, γ is the wealth elasticity of the global externality, d is the strength of global externality. Each data point summarizes the mean over 2500 time steps from 25 simulations conducted for the same initial conditions. (Online version in colour.)

