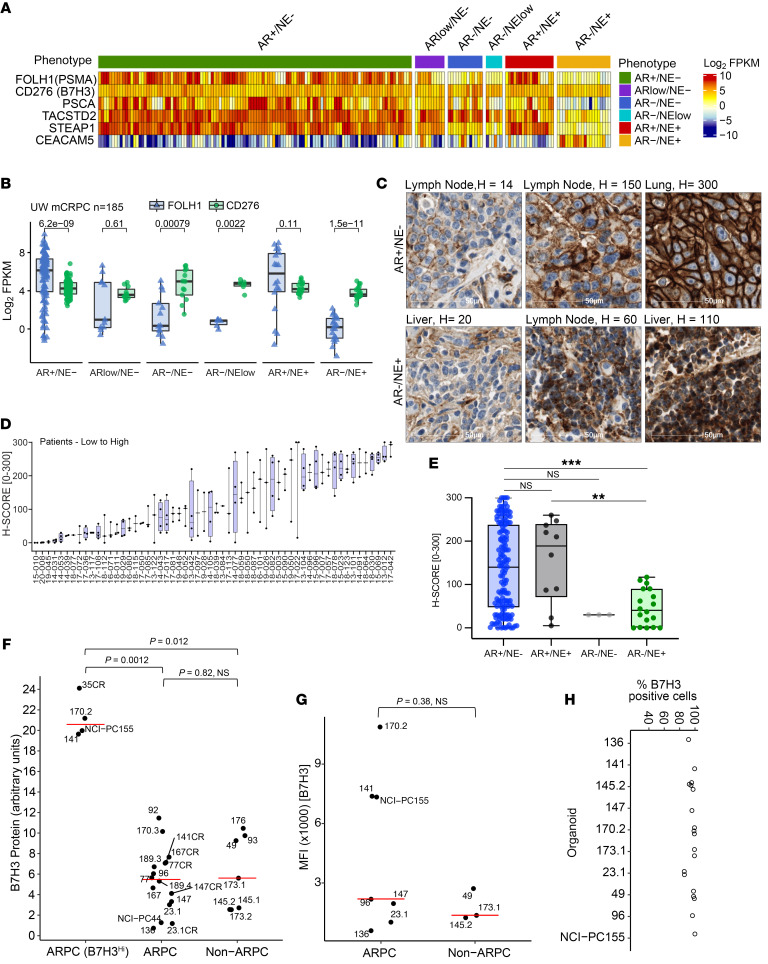
Figure 1. CD276/B7H3 expression in samples from patients with mPC and mPC PDX/organoid models.
(A) CD276/B7H3, FOLH1/PSMA, PSCA, TACSTD2/TROP2, STEAP1, and CEACAM5 transcript abundance determined by RNA-Seq analysis of 185 metastatic prostate tumors from 98 patients. Transcript levels are shown as Log2 FPKM. (B) Comparisons of CD276/B7H3 (green dots) and FOLH1/PSMA (blue dots) expression by phenotypes of metastatic tumors. Groups were compared using 2-sided Wilcoxon rank tests with Benjamini-Hochberg multiple-testing correction. (C) IHC assessments of B7H3 protein expression. Representative staining of tumors with low, medium, and high B7H3 expression in AR+/NE– and AR–/NE+ phenotypes. (D) Distribution of B7H3 protein expression in 181 metastatic tumors within and between 58 patients. (E) Distribution of B7H3 protein expression in mPCs categorized by phenotype (AR+/NE–; n = 146, AR+/NE+; n = 10, AR–/NE–; n = 3, AR–/NE+; n = 18, Cases not evaluated n = 4), **P ≤ 0.01, ***P ≤ 0.001. Wilcoxon test. (F) Western blot quantification of B7H3 protein expression in PDX tissue samples and 2 PDOs (NCI-PC44, NCI-PC155) by Simple Western. ARPC samples with high B7H3 expression are categorized separately in the B7H3HI group. Y-axis represents CD276/B7H3 protein quantification scaled by a factor of 10. For pairwise comparison between groups, Wilcoxon test was used with P value adjusted using the Holm method. P < 0.05 was considered significant. (G and H) Flow cytometry analysis for B7H3 cell–surface expression from organoids dissociated into single cells. P < 0.05; significant, Wilcoxon test. (G) Median Fluorescence Intensity (MFI) and (H) Percentage positive cells are shown for 9 analyzed models.

