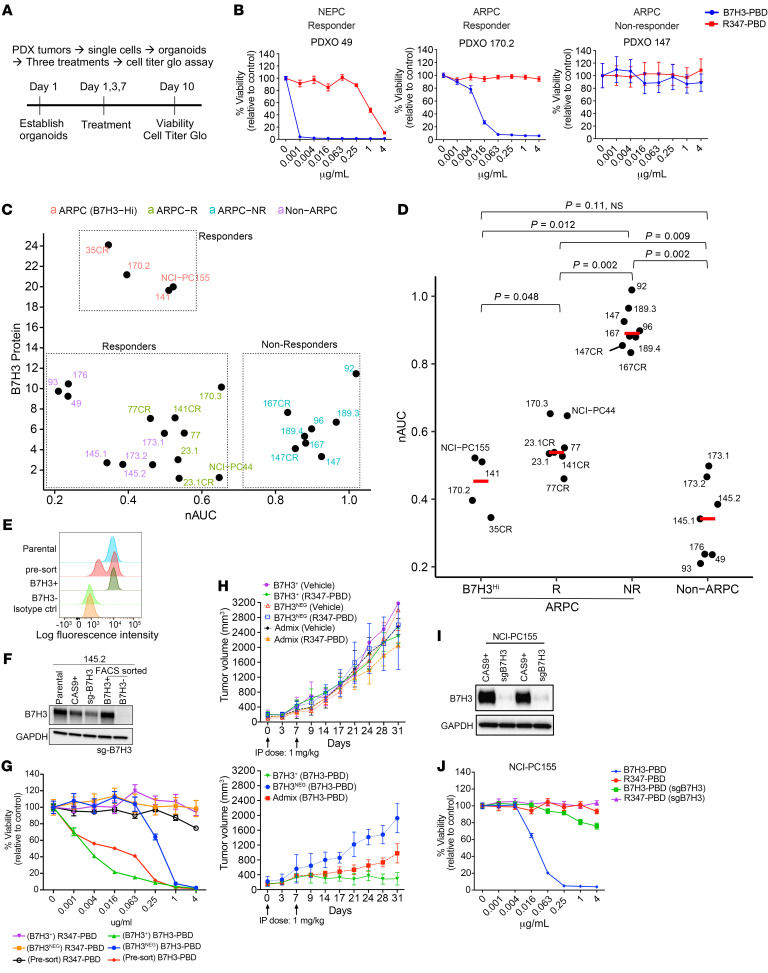
Figure 2. B7H3-PBD-ADC activity requires, but is not correlated with, B7H3 protein levels.
(A) Schematic of the ex vivo drug assay. (B) Representative drug response curves for B7H3-PBD-ADC and R347-PBD-ADC (control ADC) in PDX-derived organoids (PDXOs) of SCNPC and ARPC phenotypes. Percentage viability was plotted relative to the control. (C) Comparison of B7H3-PBD-ADC response and B7H3 protein expression across the models; n = 26. (D) nAUC values for B7H3-PBD-ADC in ARPC (n = 19) and non-ARPC models (n = 7). ARPC models are categorized into 3 groups: high B7H3 expressors (B7H3HI) n = 4, responder (R) n = 7, and nonresponder (NR) n = 8. Red line indicates median nAUC for the groups. Wilcoxon test was used for pairwise comparison between groups with P value adjusted using the Holm method. P < 0.05 was considered significant. (E) FACS sorting strategy for selecting B7H3-KO 145.2 cells. (F) Western blot for FACS sorted 145.2 B7H3+ and B7H3– (B7H3 KO) cells grown as organoids. (G) Dose response curves for 145.2 presorted and sorted B7H3NEG and B7H3+ organoids treated with ADC for 10 days. (H) 145.2 B7H3+, B7H3NEG, and admix (mix of B7H3+ and B7H3NEG cells in approximately equal proportion) ODXs treated with ADCs or vehicle, once weekly for 2 weeks, as indicated by arrows; n = 8/group, except B7H3NEG (2 mice with necrotic tumors at Day 14 excluded from B7H3-PBD group), B7H3NEG and admix (Vehicle group; n = 2 each), B7H3+ (Vehicle group; n = 4), Admix (B7H3-PBD and R347-PBD; n = 5 each). Average tumor volume is plotted from the day of first treatment indicated as Day 0. Top panel comparing average tumor volumes for R347-PBD and vehicle treated mice. Bottom panel comparing average tumor volumes for B7H3-PBD treated B7H3+, B7H3NEG, and admix xenografts. Wilcoxon test, *P < 0.05. (I) Western blot for B7H3 knockdown in NCI-PC155 organoids. (J) Dose response curves for NCI-PC155 organoids after B7H3 knockdown (sgB7H3 group). Error bars indicate the SEM.

