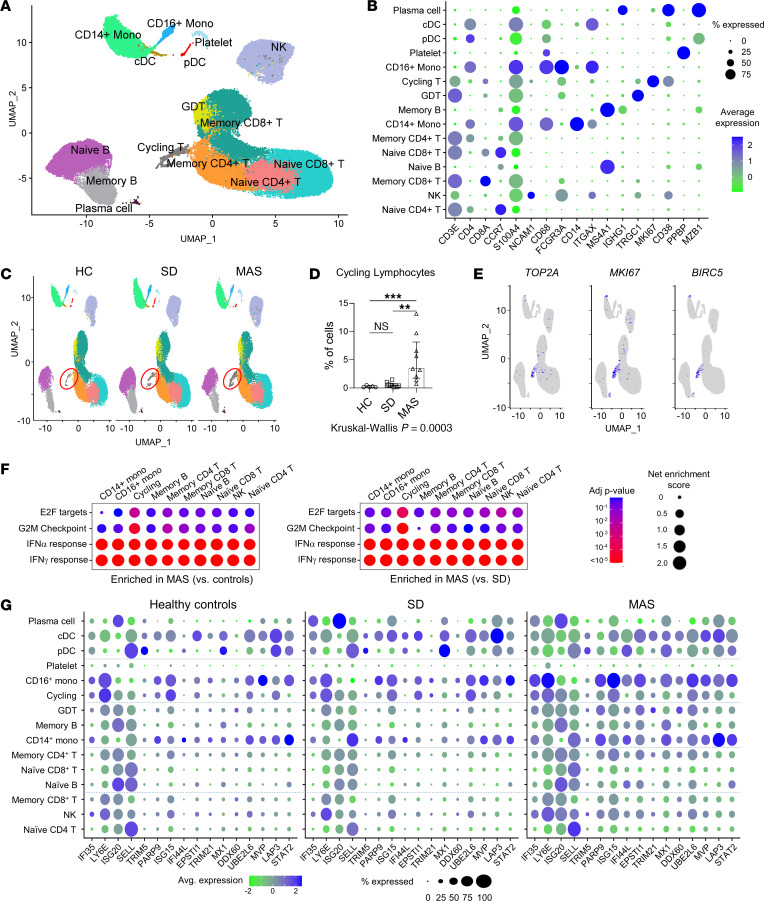
Figure 2. Single cell transcriptomic landscape of SD and MAS.
(A) UMAP display of PBMC (65,131 cells) concatenated from people in the healthy control group (n = 5), patients with SD without MAS (n = 10) and patients with MAS (n = 9). Cell subsets are labeled based on the expression of lineage-defining genes. (B) Cluster plot of lineage-defining markers for major leukocyte subsets. Size of circles represents percentage of cells expressing the indicated marker and color indicates strength of expression. (C) UMAP display of PBMC in people in the healthy control group, and patients with active SD with or without MAS. Cell populations are as defined in panel A. Red circle indicates cycling lymphocytes. (D) Quantification of cycling lymphocytes in people in the healthy control group and patients with SD with or without MAS. (E) Feature plot illustrating the expression of cell proliferation markers TOP2A, MKI67, and BIRC5. (F) Cluster plot of GSEA comparing hallmark gene sets (IFN-I response, IFN-γ response, E2F targets, and G2M checkpoint) in major immune cell populations. The MAS group was compared with the healthy control group (left) and patients with SD without MAS (right). Size of circles represents the degree of enrichment and color indicates P value. (G) Cluster plot of IFN-stimulated gene expression among leukocyte subsets. Size of circles represents percentage of cells expressing the indicated marker, while color indicates strength of expression. Statistical analysis: Bars represent the median and error bars indicate interquartile range in panel D. Kruskal-Wallis test was used for comparison of multiple groups and Dunn’s correction was applied for the indicated comparisons. **P < 0.01, ***P < 0.001.

