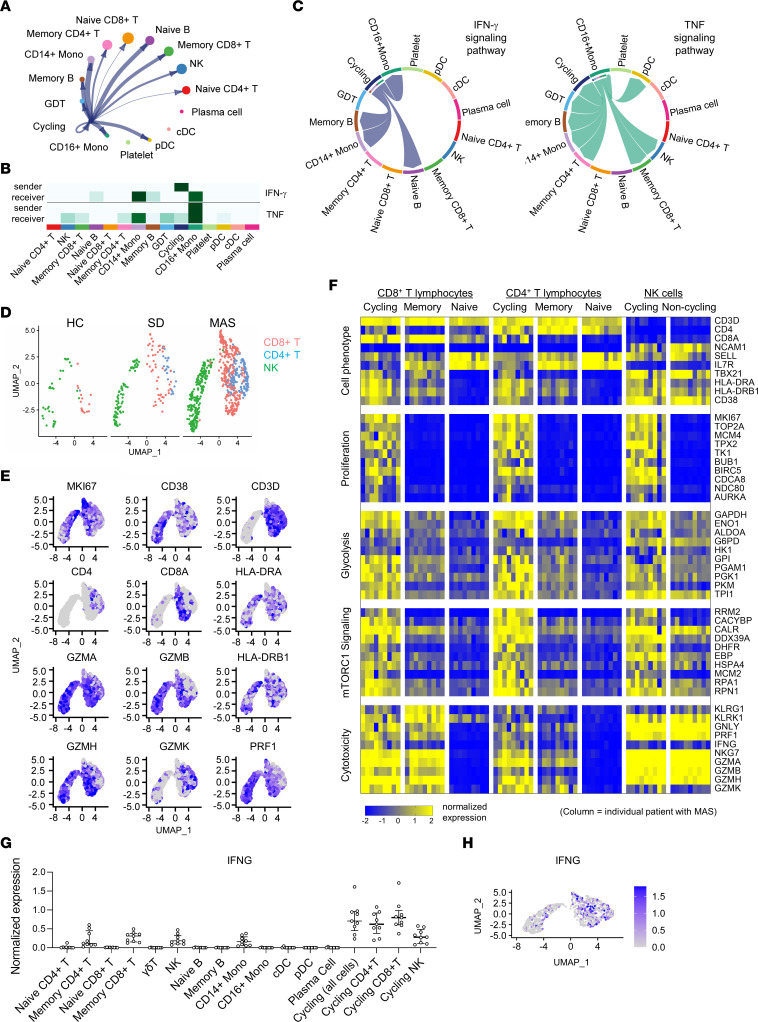
Figure 3. scRNA-Seq analysis of cycling lymphocyte subsets in patients with MAS.
(A) Circular plot illustrating cellular communication between cycling lymphocytes and other PBMC subsets. Cell populations are as defined in Figure 2. (B) heatmap display and (C) chord diagram of projected sender(s) and receiver(s) of IFN-γ and TNF signaling in PBMC cell subsets based on CellChat analysis of scRNA-Seq data from patients with MAS. (D) UMAP display of cycling lymphocytes from people in the healthy control group (n = 5), patients with SD without MAS (n = 10), and patients with MAS (n = 9). (E) Feature plot illustrating the expression of lineage and phenotypic markers in cells from patients with MAS. Cell populations are as defined in panel D. (F) Heatmap display of gene expression in cycling lymphocytes and major T and NK cell subsets in patients with MAS. Each column represents data from a single patient. Genes were selected from the leading edge of GSEA comparing cycling lymphocytes and all other cell subsets. (G) Quantification of average IFNG expression in indicated immune cell subsets in patients with MAS. Cycling lymphocytes were shown as a group and as individual subsets of T cells and NK cells. (H) Feature plot illustrating expression of IFNG in cycling lymphocytes from patients with MAS.

