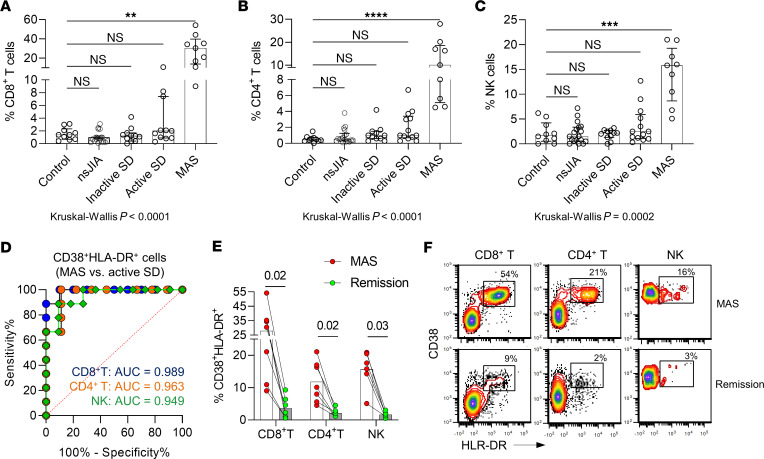
Figure 4. Flow cytometry analysis of CD38+HLA-DR+ lymphocyte subsets.
(A) Quantification of CD38+HLA-DR+CD8+ T cells, (B) CD38+HLA-DR+CD4+ T cells, and (C) CD38+HLA-DR+C56+ NK cells in healthy children (n = 10), and patients with nonsystemic JIA (n = 15), inactive SD (n = 11), active SD without MAS (n = 11), or active SD with MAS (n = 9). (D) Receiver operator characteristic curve illustrating the utility of using CD38+HLA-DR+ lymphocytes (as a percentage of T cell or NK cell pool) in distinguishing cases of SD-associated MAS (n = 9) from patients with active SD without MAS (n = 11). (E) Quantification and (F) representative flow cytometry plot of CD38+HLA-DR+ lymphocyte subsets in 6 patients during MAS and after resolution of MAS. Statistical analysis: Bars in panels A–C represent the median and error bars indicate interquartile range. Kruskal-Wallis test was used for comparison of multiple groups and Dunn’s correction was applied for the comparisons with the control group (panels A–C). Wilcoxon signed-rank test was used for panel E. *P < 0.05, **P < 0.01, ***P < 0.001, ***P < 0.0001.

