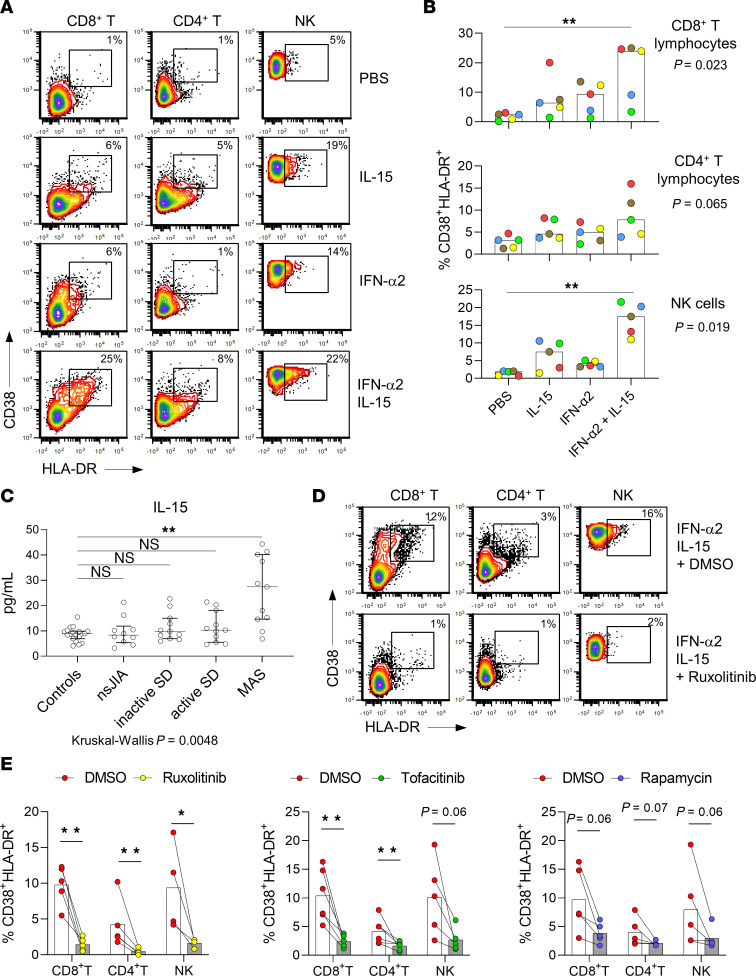
Figure 6. Generation of CD38+HLA-DR+ T lymphocytes and NK cells in vitro.
(A) Representative flow cytometry plot and (B) quantification of CD38+HLA-DR+ lymphocyte subsets induced by coculturing PBMC from healthy controls (n = 5) with the indicated cytokine combinations for 2 days. Each color in panel B represents a unique healthy donor. Results for each healthy donor represent the average of duplicate samples. (C) Plasma IL-15 levels in healthy controls (n = 19), and patients with nonsystemic JIA (n = 10), inactive SD (n = 11), active SD without MAS (n = 11), or active SD with MAS (n = 11) as measured by proximity extension assay. (D) Representative flow cytometry plots and (E) Quantification of CD38+HLA-DR+ lymphocyte subsets induced by IL-15 (10 ng/mL) and IFN-α2 (10 ng/mL) in PBMCs (from 4–5 healthy donors) pretreated with ruxolitinib (100 nM), tofacitinib (100 nM), rapamycin (1 μM), or DMSO (vehicle control). Inhibitors or DMSO were added 30 minutes prior to IL-15 and IFN-α2 stimulation, and analysis was performed after 2 days. Statistical analysis: Bars represent median and error bars represent interquartile range. Kruskal-Wallis test was used for comparison of multiple groups in panels B and C, and Dunn’s correction was applied for the indicated comparisons. Mann-Whitney U test was applied for panel E. *P < 0.05, **P < 0.01.

