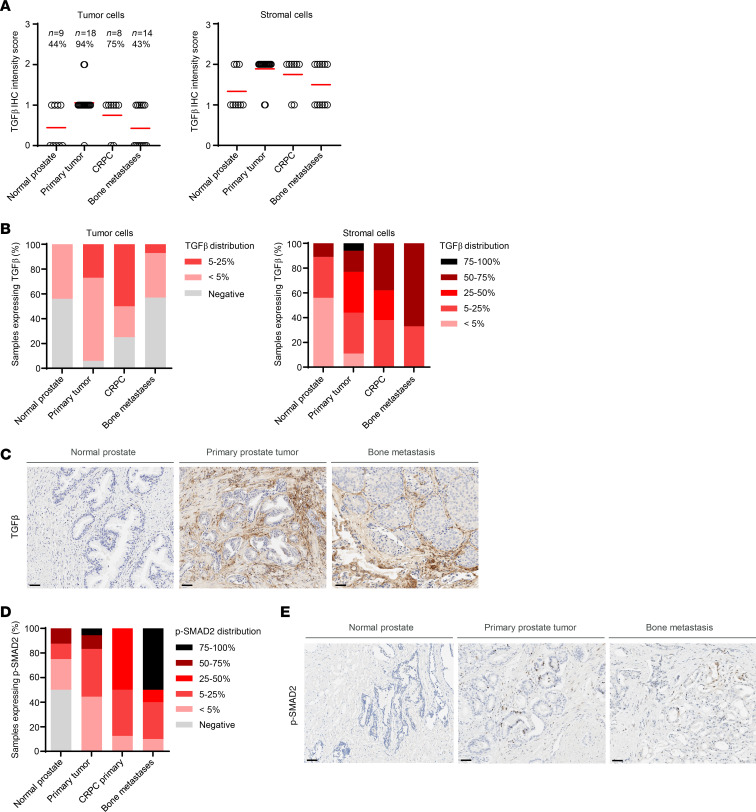
Figure 2. Prevalence of TGF-β throughout prostate cancer progression.
(A) The same prostate cancer TMA samples shown in Figure 1 were profiled for expression of TGF-β by IHC. The TGF-β staining intensity in tumor and stromal cells was quantified. (B) Distribution of TGF-β staining in tumor and stromal cells. (C) Representative images of TGF-β staining in normal prostate sample, primary prostate tumor, and prostate cancer bone metastatic sample, highlighting the contribution of tumor and stromal cell TGF-β in the TME. (D) IHC for p-SMAD2 was performed on the samples shown in A, and the distribution of expression in each prostate cancer disease subset was quantified. (E) Representative images of p-SMAD2 staining quantified in D. All images include a 50 μm scale bar at bottom left.

