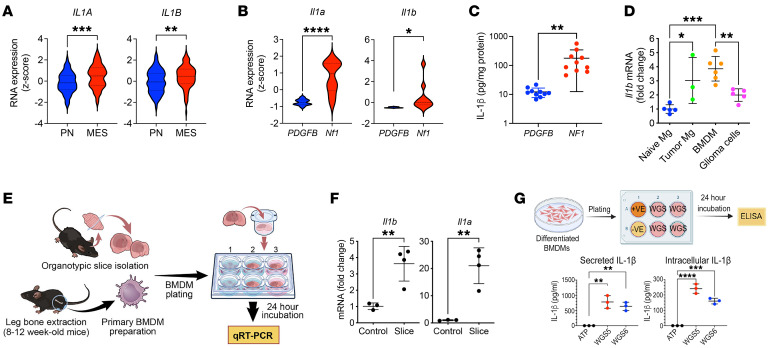
Figure 2. IL1B expression is increased in human MES GBM and Nf1-silenced murine GBM.
(A) IL1A and IL1B RNA expression in PN (n = 69) and MES (n = 106) human GBM patient samples from TCGA. Two-tailed Student’s t test. (B) qPCR for Il1a and Il1b RNA expression from murine PDGFB-driven (n = 10) and Nf1-silenced (n = 10) GBM samples. Two-tailed Student’s t test. (C) IL-1β in PDGFB-driven (n = 10) and Nf1-silenced (n = 10) murine GBM tissues by ELISA. Two-tailed Student’s t test. (D) qPCR of Il1b expression in FACS-sorted cells from naive brain (n = 5) and PDGFB-driven tumors (n = 3 to 6). One-way ANOVA with Tukey’s post hoc comparisons. (E) Diagram illustrating the coculturing system of primary murine BMDM and PDGFB-driven tumor slices. (F) qPCR of Il1a and Il1b expression in BMDMs cocultured with tumor slices (n = 3 and 4 respectively). Two-tailed Student’s t test. (G) IL-1β expression from BMDM cocultured with primary PN glioma stem-like cells (WGS, n = 3 each group). One-way ANOVA with Tukey’s post hoc comparisons. *P < 0.05; **P < 0.01; ***P < 0.001; ****P < 0.0001.

