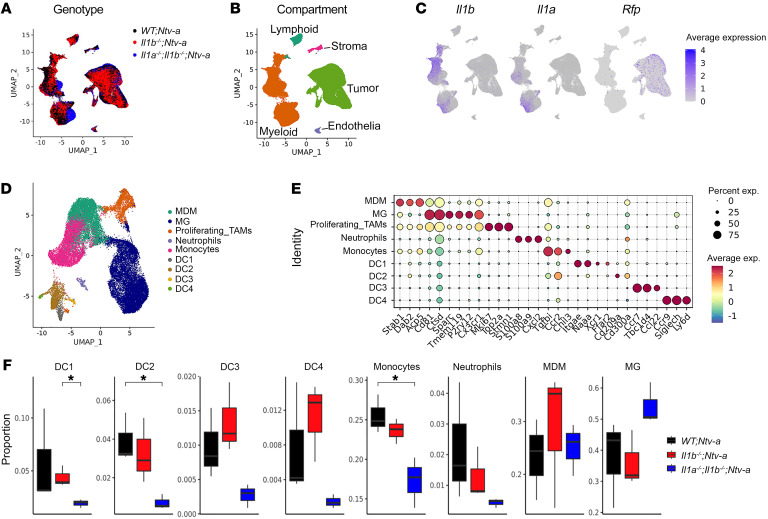
Figure 4. scRNA-Seq reveals reduction in inflammatory monocytes in Il1b–/–;Ntv-a mice.
(A) UMAP dimensionality reduction of the scRNA-Seq data of tumors isolated from WT;Ntv-a (black, n = 3), Il1b–/–;Ntv-a (red, n = 3), and Il1a–/–;Il1b–/–;Ntv-a (blue, n = 3) mice. (B) UMAP of single cells in A colored by annotated cell class. (C) Il1a, Il1b, and Rfp expression overlayed on the same UMAP coordinates. (D) UMAP dimensionality reduction of myeloid cells in the tumors subclustered and colored by annotated myeloid subtypes. (E) Dot plot of selected marker genes defining different myeloid subtypes. (F) Composition of myeloid cell subpopulations in tumors generated in WT;Ntv-a, Il1b–/–;Ntv-a and Il1a–/–;Il1b–/–;Ntv-a mice. Two-tailed Student’s t test.*P < 0.05.

