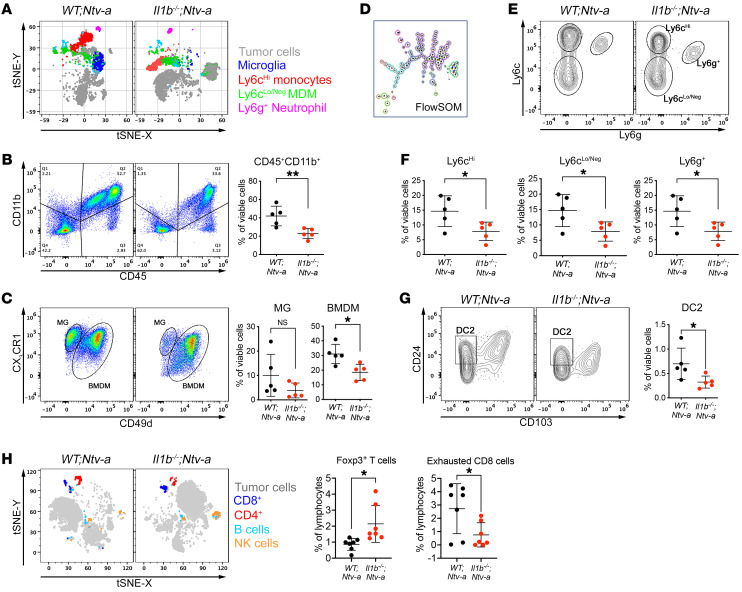
Figure 5. Il1b ablation reduces the influx of inflammatory monocytes and DC2s into tumors.
(A) t-Distributed stochastic neighbor embedding (tSNE) plots of spectral flow cytometry illustrating the tumor cell/myeloid composition in WT;Ntv-a (n = 5) and Il1b–/–;Ntv-a mice (n = 5) bearing PDGFB-driven GBM. (B and C) Gating strategy for myeloid cells, discriminating between resident brain MG and BMDM, with corresponding quantification dot graphs. Two-tailed Student’s t test. (D) Illustration of FlowSOM differentiating subtypes of BMDMs. (E) Representative contour plots for gating monocytes (Ly6chi), differentiated macrophages (Ly6clo/Neg), and neutrophils (Ly6g+). (F) Quantification of myeloid cell subtypes depicted in E. Two-tailed Student’s t test. (G) Representative plots and quantification of DC2 populations in WT;Ntv-a and Il1b–/–;Ntv-a mice bearing PDGFB-driven GBM. Two-tailed Student’s t test. (H) tSNE plots and quantification of lymphoid cells by spectral flow cytometry (n = 7 for both groups). Two-tailed Student’s t test.*P < 0.05; **P < 0.01.

