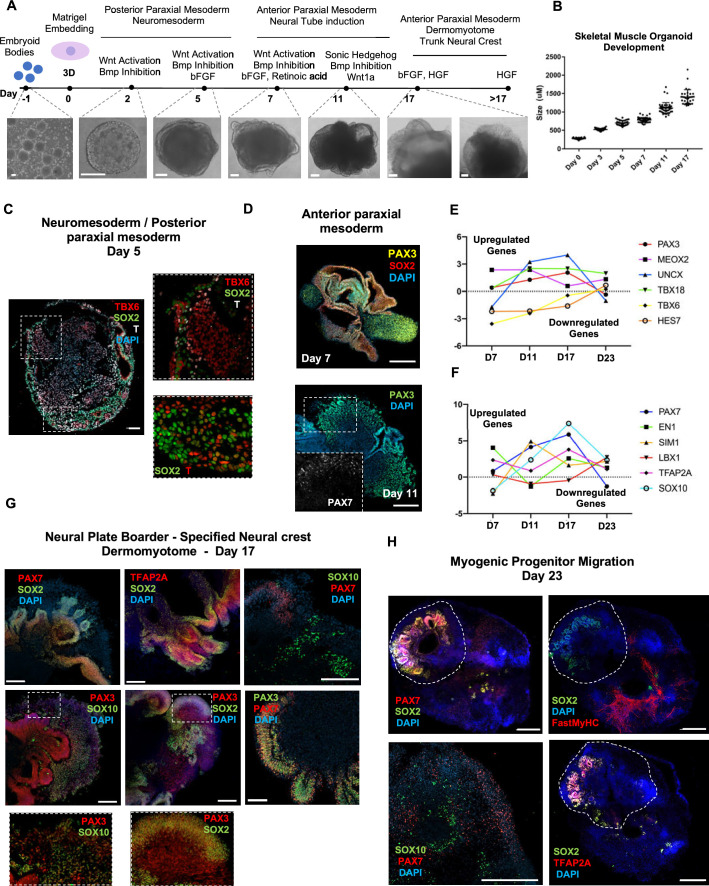
Figure 1. Skeletal muscle organoid protocol and correlation to fetal development.
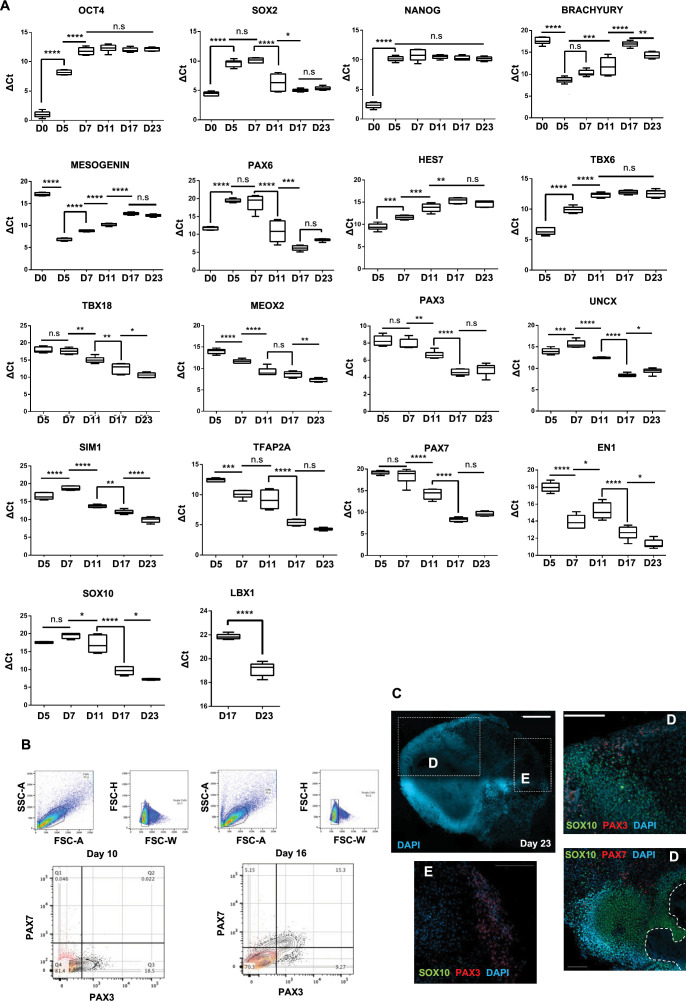
(A) Brightfield images of myogenic development stages, with corresponding cytokines/growth factors protocol applications. (B) Graph depicting organoid development in size (day 0, n = 51; day 3, n = 46; day 5, n = 48; day 7, n = 50; day 11, n = 50; day 17, n = 33; for each timepoint organoids from three independent derivations were measured). (C) Representative mesodermal T+, neuromesodermal T+, SOX2+, and paraxial mesodermal TBX6+ organoid expression (in live DAPI- cells) on day 5. (D) Representative organoid PAX3+, mesodermal SOX2-, and neural SOX2+ expression on day 7; PAX3/PAX7 coexpression on day 11. (E) Graph depicting qPCR values for anterior PAX3/UNCX/MEOX2/TBX18 and posterior TBX6/HES7 somitic mesodermal markers. (F) Graph depicting qPCR values for epaxial and hypaxial dermomyotomal PAX7/EN1/SIM1/LBX1 and neural crest TFAP2A/SOX10 markers. (G) Representative organoid neural plate border epithelial PAX3+/PAX7+/SOX2+/TFAP2A+, paraxial mesodermal PAX3+/SOX2-, and delaminating specified neural crest progenitor PAX3+/SOX10+ expression on day 17. (H) Representative organoid myogenic FastMyHC+, PAX7+, and neural SOX2+/TFAP2A+/SOX10+ expression on day 23. Dashed line represents the location of embryoid body embedded into Matrigel. Statistics: values at each timepoint represent the difference in mean relative expression for each gene (D7 = day 5–day 7, D11 = day 7–day 11, D17 = day 11–day 17, D23 = day 17–day 23) as derived by performing ordinary one-way ANOVA and Tukey’´s multiple-comparison tests (E, F). Scale bars: 200 μm (G), 100 μm (A, D, H), 50 μm.


