. 2023 Nov 14;12:RP87081. doi: 10.7554/eLife.87081

Figure 4. Myogenic progenitor identity and comparison to progenitors derived from fetal and adult muscle tissue.

(A) t-SNE plot visualization of color-coded clustering indicates myogenic progenitor subcluster with distinct molecular signatures: ‘dormant’ PAX7high/CHODLhigh/FBN1high, ‘activated’ CD44high/CD98+/MYOD1+, and ‘mitotic’ KI-67+/CDK1+/TOP2A. (B) Organoid overviews on day 98 illustrate CD44 and PAX7-expressing cells at developing sites, which are more accessible to HGF activation signal, specificity of CD44 on MYOD+/PAX7+ progenitor-expressing cells (arrows) and absence from FastMyHC+ positive myofibers is highlighted. (C) FBN1+ microfibrils are located toward organoid interior. (D) Pseudotime ordering for myogenic progenitors and myoblast corresponding clusters highlights distinct developmental trajectories promoting myogenic commitment and self-renewal. (E) Correlation coefficient plot for Log2 fold change (Log2 FC) values for isolated myogenic progenitors from human fetal tissue (17w) and FACS-sorted CXCR4+/ITGβ1+ organoid-derived myogenic progenitors (16w). PAX7, COL1A1, COL3A1, COL4A1, COL5A1, COL15A1, FBN1, and CHODL and further extracellular matrix-related genes are highlighted on the plot. Pearson’s correlation coefficient, rho = 0.9 for global expression comparison and rho = 0.97 for selected genes. (F) UMAP color-based clustering divides non-dividing myogenic progenitors and adult satellite cells into four clusters with distinct molecular signatures: satellite cells characterized by SPRY1high/ZFP36high/MYF5high expression, co-clustered with dormant SPRY1high/FBN1high/CHODLhigh/PAX7high, activated CD44high/CD98high/MYOD1+, and committed, NEB high/MYH3high/MYOD1high organoid-derived myogenic progenitors. Dots correspond to adult satellite cells from GSE130646 database, triangles correspond to organoid-derived myogenic progenitors. (G) Violin plots depicting relative expression levels of markers specific for quiescent PAX7 or activated MYF5 muscle stem cell state across adult satellite cells (GSE130646) and organoid-derived myogenic progenitors subclusters. (H) Ridge plots of developmental score distribution of myogenic progenitors across in vivo or in vitro stages based on the difference between upregulated satellite cell and embryonic markers from human reference atlases for weeks (Wk) 5–18 embryonic and fetal stages, years (Yr) 7–42 adult satellite cells and skeletal muscle (SM) organoid. (I, J) In vivo engraftment potential of human myogenic progenitors. 100.000 CD82+ sorted human cells were injected into Tibialis anterior muscle of nude mice. (I) Control mice were not injected (J). Six weeks post transplantation, transverse cryosections of muscle fibers were stained with huLamin A/C (green), dystrophin (red), and DAPI (blue). Human cells appear green and red in contrast to murine cells, which only show a dystrophin-positive red staining. Scale bars 200 μm in (I, J).

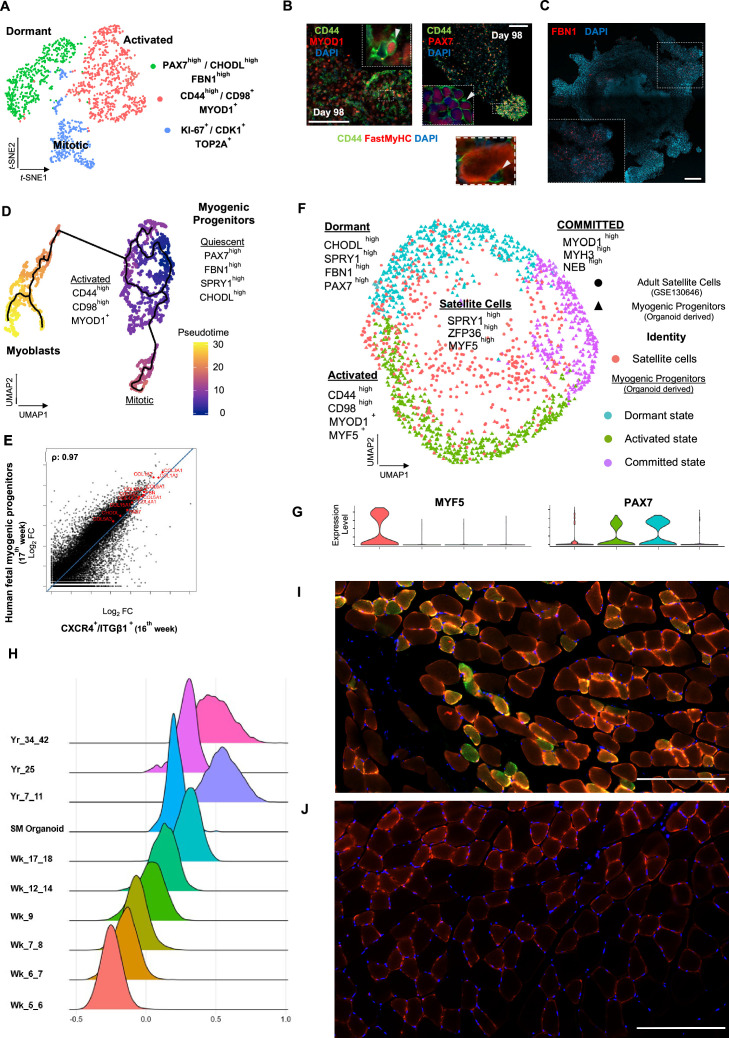
Figure 4.

Figure 4—figure supplement 1. Subclustering of myogenic progenitors and NOTCH signaling.

Figure 4—figure supplement 1.

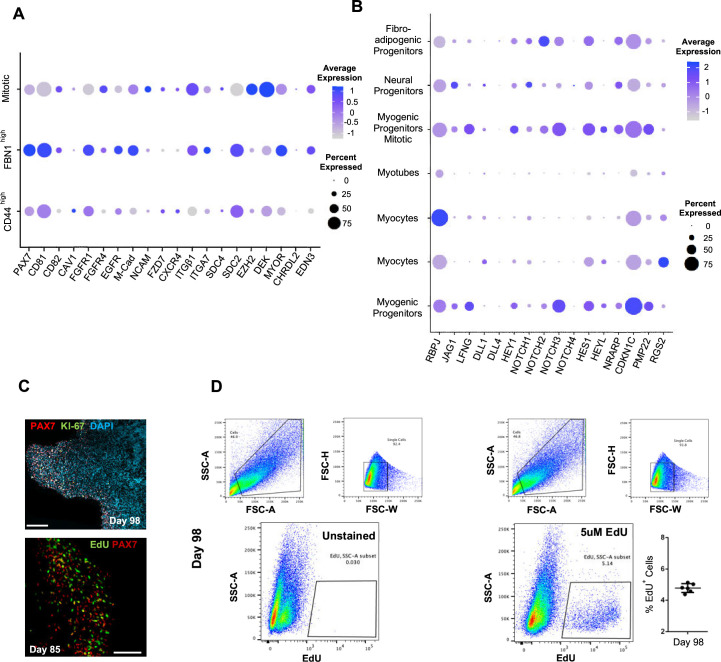
(A) Dot plot showing expression of representative genes related to satellite cell identity across the seven main clusters. (B) Dot plot showing expression of representative genes related to NOTCH signaling, which are identified as regulators of satellite cell quiescence across the seven main clusters. (C) Organoid immunohistochemistry on day 98 indicates PAX7 myogenic progenitors that are Ki-67-/EdU-. (D) Gating strategy applied to quantify EdU+ proliferating cells in organoid culture on day 98 (14 wk); histograph depicting percentage of EdU+ cells; dot plot, circle area represents percentage of gene+ cells in a cluster, color reflects average expression level (gray, low expression; blue, high expression). Scale bars, 100 uM in (C).
Figure 4—figure supplement 2. Pseudotime ordering of myogenic progenitor revealing distinct states and cell fate decisions.

Figure 4—figure supplement 2.

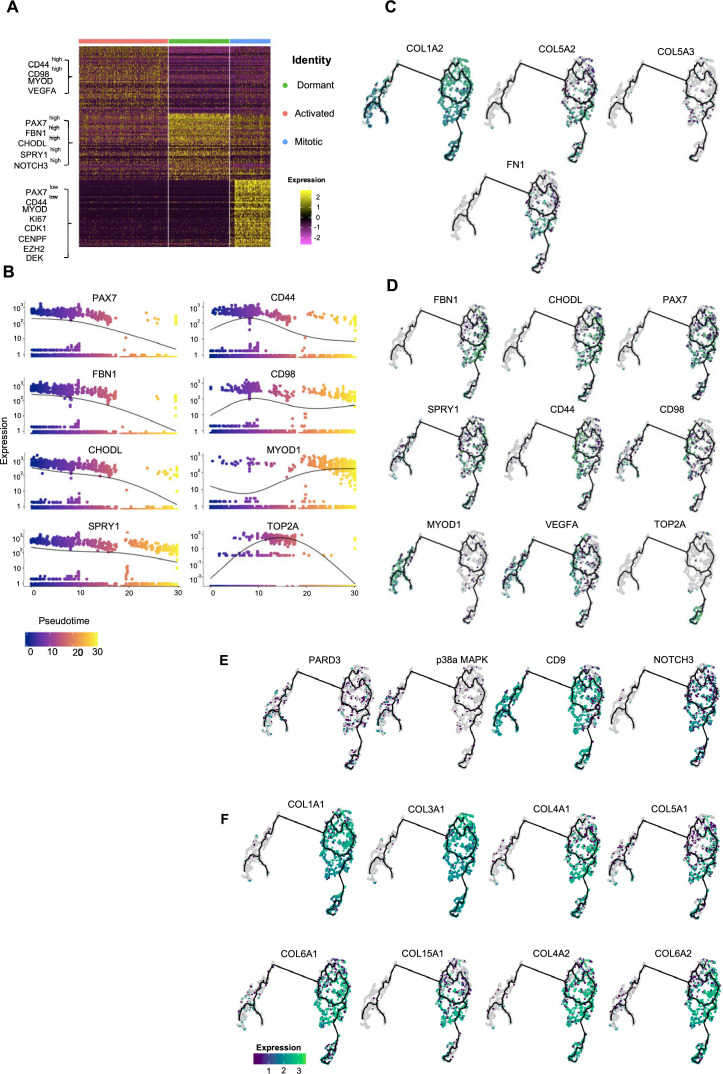
(A) Gene signatures of t-SNE described clusters based on relative expression levels of the 50 most significant markers for each of the three clusters. (B) Expression of selected genes along pseudotime. Group of genes selected for myogenic progenitors: PAX7, SPRY1, CHODL (dormant state), CD44, CD98, MYOD1 (activated state), TOP2A (mitotic state), and for myoblasts: MYOD1. (C, D) UMAP feature plots depicting relative expression of extracellular matrix proteins COL1A2, COL5A2, COL5A3, FN1 (C) and selected transcriptional regulators that define dormant (PAX7, FBN1, CHODL, SPRY1), activated (CD44, CD98, MYOD1, VEGFA), and mitotic (TOP2A) state of myogenic progenitor and myoblast (MYOD1) clusters (D). (E, F) UMAP feature plots depicting relative expression of genes regulating asymmetric divisions and self-renewal (PARD3, p38a/b, CD9, NOTCH3) (E) and extracellular matrix collagens (COL1A1, COL3A1, COL4A1, COL5A1, COL6A1, COL15A1, COL4A2, COL6A2) (F).
Figure 4—figure supplement 3. Organoid-derived myogenic progenitors and correlation to fetal muscle progenitors.

Figure 4—figure supplement 3.

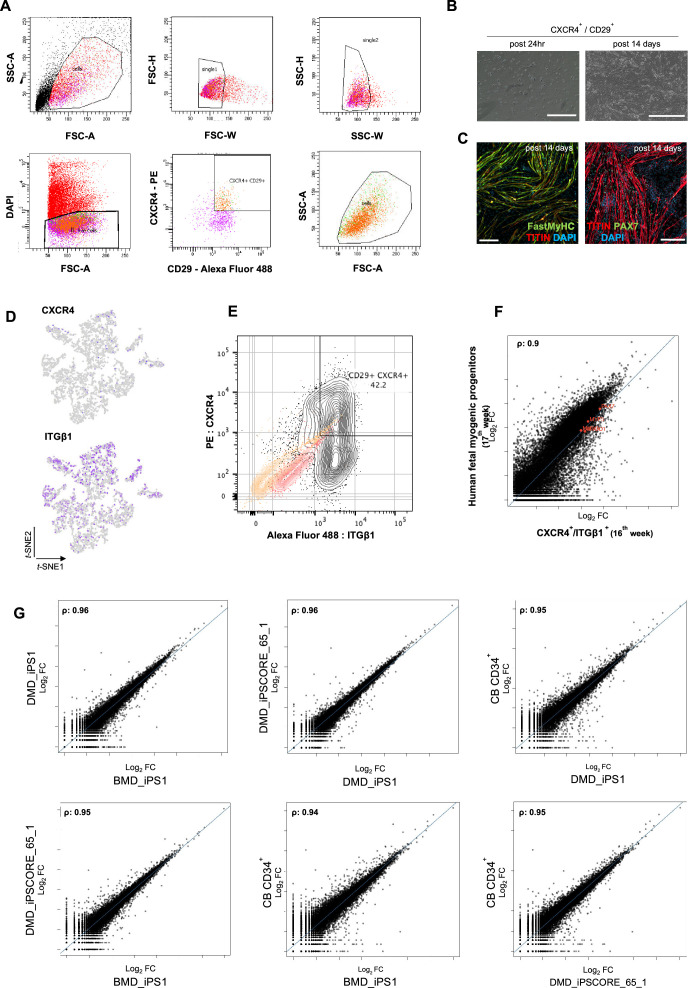
(A) Gating strategy applied for FACS sorting CD29+/CXCR4+ cells from 15 to 16 wk skeletal muscle organoids. (B, C) Re-plating CD29+/CXCR4+ cells and culturing for 14 d highlights fetal myogenic potential, illustrated by brightfield and immunocytochemistry images for Fast MyHC+, TITIN+, and PAX7+ populations. (D) t-SNE feature plots for ITGβ1 and CXCR4 demarcate expression of FACS isolated calls into myogenic progenitor subcluster. (E) Gating strategy from (A) together with unstained population (yellow), isotype control (red), and CD29+/CXCR4+ (gray) population. (F) Correlation coefficient plot for Log2 fold change (Log2 FC) values for isolated myogenic progenitors from human fetal tissue (17w) and FACS-sorted CXCR4+/ ITGβ1+ organoid-derived myogenic progenitors (16w). PAX7, MYF5, MYOD1, MYOG are highlighted on the plot. (G) Correlation coefficient plot for Log2 FC values for FACS-sorted CXCR4+/ ITGβ1+ organoid-derived myogenic progenitors (16w) from CB CD34+, DMD_IPS1, BMD_iPS1, and iPSCORE_65_1 pluripotent lines. Scale bars, 200 uM (B), 100 uM (C).
Figure 4—figure supplement 4. Organoid-derived myogenic progenitors and correlation to adult human satellite cells.

Figure 4—figure supplement 4.

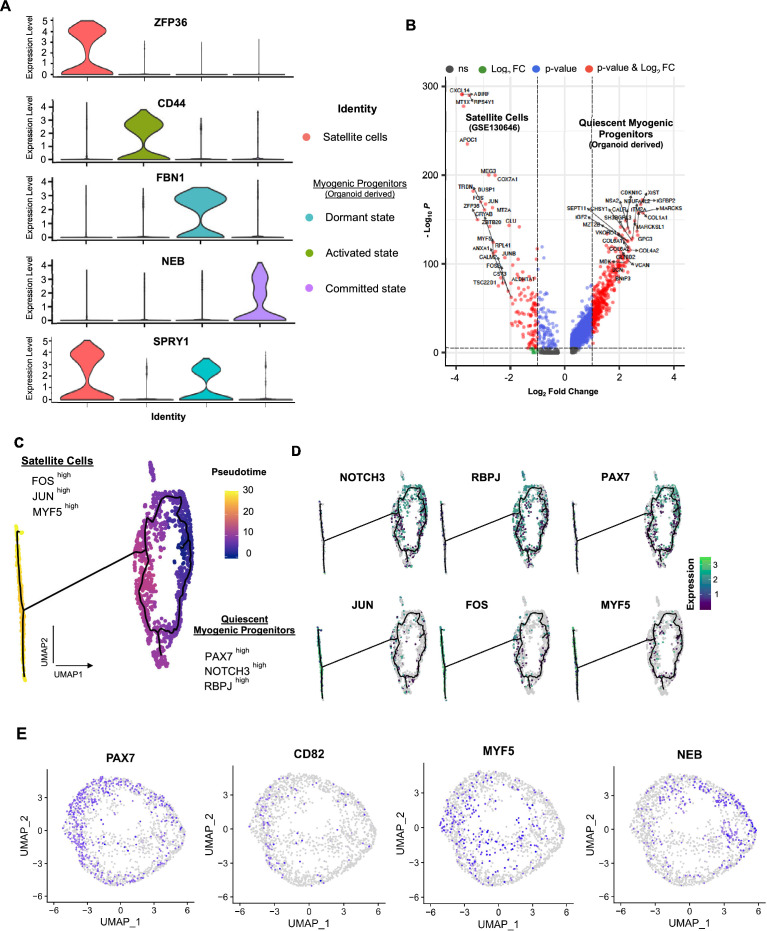
(A) Violin plots highlighting developmental status for organoid-derived myogenic progenitors and satellite cells through relative expression of key signature markers ZFP36, CD44, FBN1, NEB, and SPRY1 for each subcluster. (B) Enhanced volcano plot from comparing transcript levels between all adult satellite cells (GSE130646) and organoid-derived myogenic progenitors. Log2 fold-change in normalized gene expression vs. –Log10 adjusted p-value is plotted. Differentially expressed genes: blue, adjusted p-value<0.001; green, adjusted p-value>0.001 and log2 fold-change >1; red, log2 fold-change >1 and adjusted p-value <0.001; gray, no significance. (C) Pseudotime ordering for organoid-derived myogenic progenitors and adult satellite cells together with expression of selected genes. (D) Expression of genes selected for dormant myogenic progenitors (PAX7, NOTCH3, RBPJ) and activated satellite cells (MYF5, JUN, FOS). (E) UMAP feature plots depicting expression of PAX7, CD82+, MYF5, and NEB within the myogenic progenitor and adult satellite cell clusters corresponding to Figure 4F.
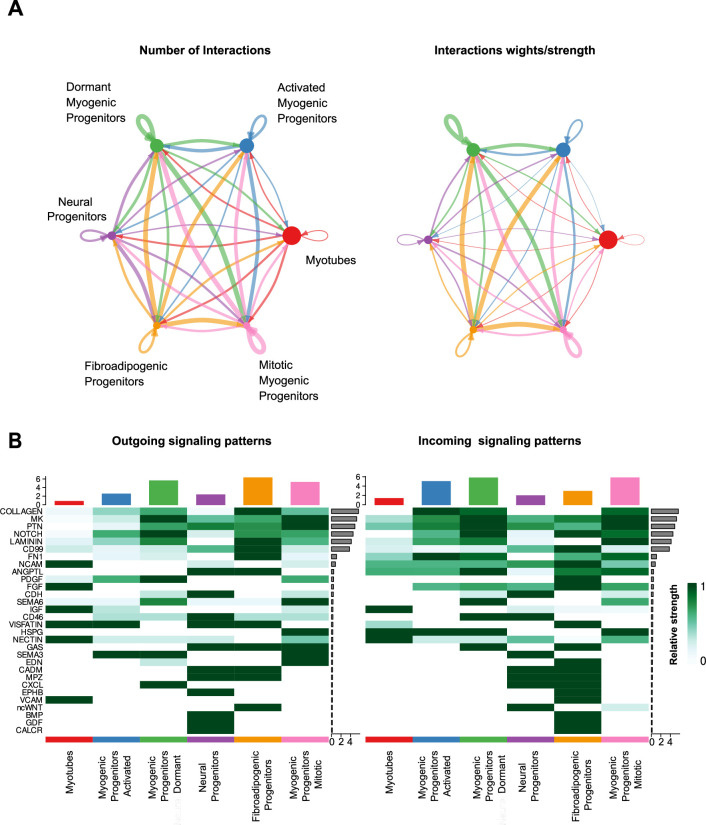
Figure 4—figure supplement 5. Characterization of cell–cell communication network for all clusters at week 12 of human skeletal muscle organoid development.

Figure 4—figure supplement 5.

(A) Circle plot illustrates the aggregated cell–cell communication network for all clusters at week 12 of human skeletal muscle organoids development. Circle sizes are proportional to the number of cells in each cell group and edge width represents the communication probability. (B) Heatmap indicating signals contributing most to the outgoing or incoming signaling among activated, mitotic, dormant/specification-resistant myogenic progenitors and fibroadipogenic progenitors, neural progenitors and myofibers-related clusters at week 12 of human skeletal muscle organoid development.
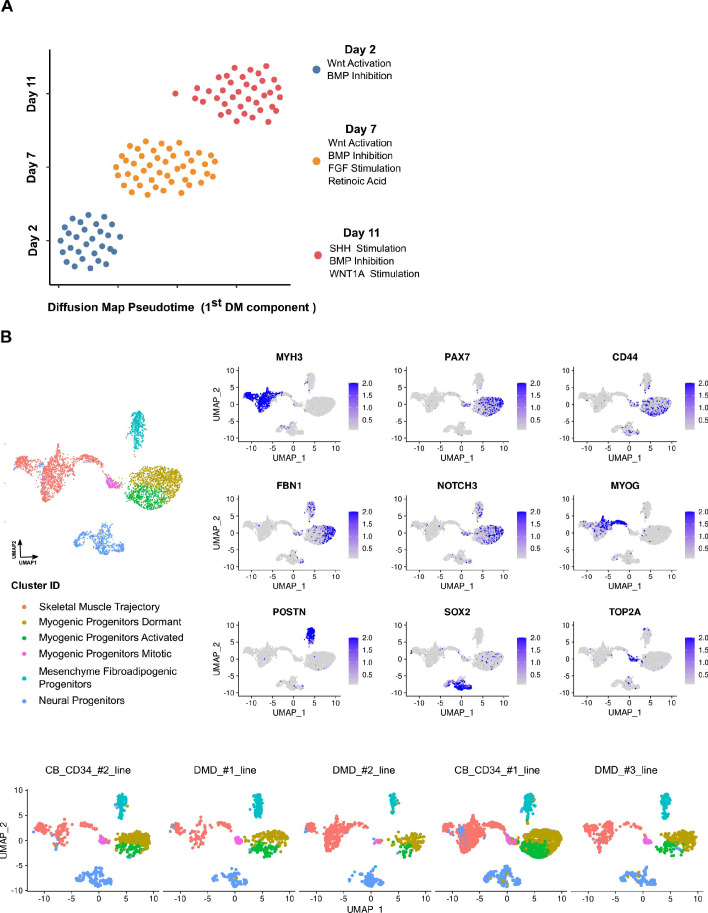
Figure 4—figure supplement 6. Reproducibility of organoid culture at early and mature stages.

Figure 4—figure supplement 6.

(A) Pseudotemporal ordering of organoids from days 2, 7, and 11 based on qPCR expression profiling of selected 32 genes indicates robust homogeneous development of organoids during WNT activation and BMP Inhibition, while the subsequent development of paraxial mesoderm and neural tube-related lineages via bFGF, retinoic acid (day 7) and WNT1a, hSHH (day 11) stimulation, introduced small variations to the organoid culture system. (B) Integrative analysis between datasets of organoids from different lines demonstrates highly conserved lineage representation for all datasets at mature stages (week 12) of human skeletal muscle organoid development. Feature plots on PAX7, CD44, FBN1, MYH3, POSTN, SOX2, as well as NOTCH3, MYOG, TOP2A indicate the presence of dormant, activated, and mitotic myogenic progenitors together with skeletal muscle myofibers, fibroadipogenic progenitors, and neural progenitors-related clusters.
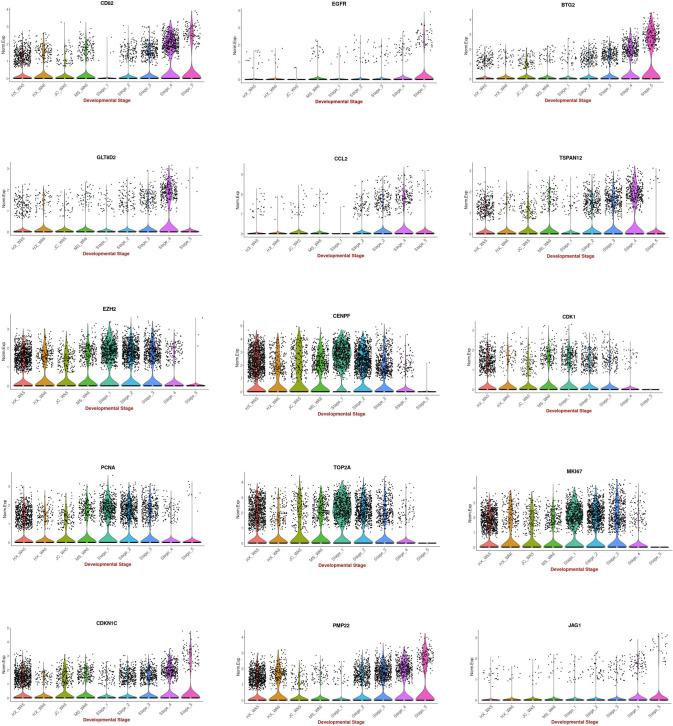
Figure 4—figure supplement 7. Comparison between 2D in vitro myogenic differentiation protocols and in vivo staging.

Figure 4—figure supplement 7.

Violin plots highlighting expression of key myogenesis markers: Comparison between myogenic progenitors derived in 2D differentiation protocols (HX protocol, Xi et al., 2017; JC protocol, Chal et al., 2015; MS protocol, Shelton et al., 2014) and in vivo myogenic progenitors (five stages: 1, 2: embryonic; 3, 4: fetal; 5: postnatal). Data were acquired from Pyle ´s LAB UCLA website (here) and Xi et al., 2020.