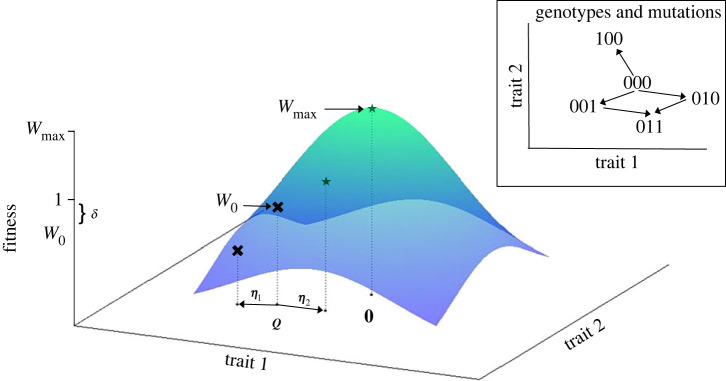
Figure 1.
Fisher’s geometric model defines fitness (coloured surface) as a function of trait values, illustrated here for N = 2. The peak fitness Wmax occurs at the optimal trait values, shown here as 0. In an evolutionary rescue scenario, the wild-type phenotype, Q, has fitness W0 < 1. Mutations occur as displacement vectors, η. In this example, if mutation η1 occurs, fitness is reduced. However if η2 occurs, trait values move closer to the optimum and fitness is greater than unity (stars and black crosses indicate fitness values >1 and <1 respectively.) In the classic version of FGM, mutations can move the phenotype Q to any point in trait space. In contrast in the genotypic realization, the phenotype Q can only ‘jump’ by additive combinations of a finite set of ηi. An illustration for two traits, N = 2, and sequence size L = 3 is provided in the inset. Here the phenotype associated with genotype 011 is obtained from 000 by additively combining η2 and η3.

