
Figure 3.
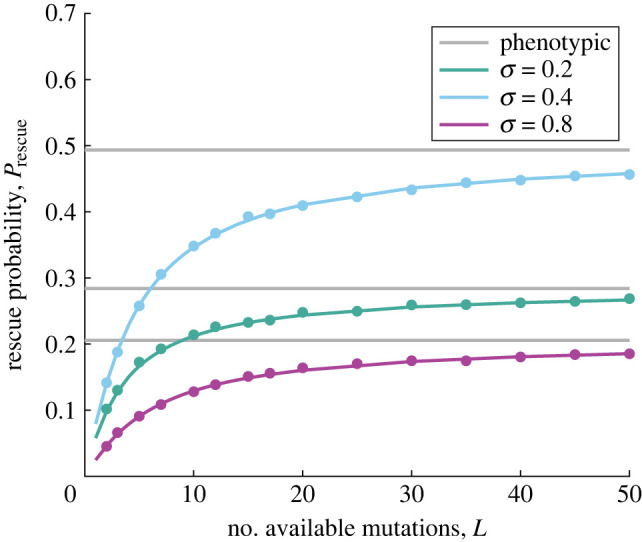
Rescue probability versus the number of available mutations. The probability of evolutionary rescue for the classic, phenotypic FGM (grey lines, equation (3.6)) and for the genotypic model (equation (3.12)) is plotted versus the number of available mutations, L. We find that the rescue probability is reduced in the genotypic model, but approaches the prediction for the phenotypic model as L grows large. Filled circles are simulation results (error bars are similar to or smaller than symbol heights and have been omitted). Results are shown for different values of mutation size effect, σ, as indicated in the legend. Other parameters are: N = 5, U = 10−3, δ = 0.2, ρ = 1.