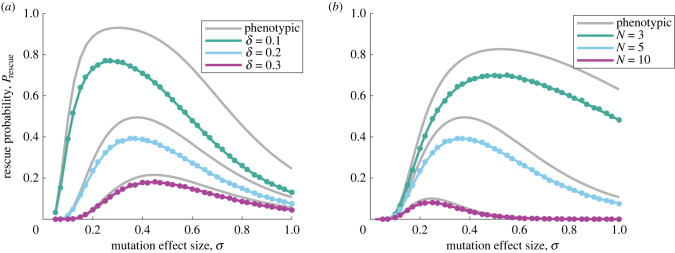
Figure 4.
Rescue probability versus mutation effect size as the distance to the fitness optimum or the dimensionality of trait space varies. The probability of evolutionary rescue for the classic, phenotypic FGM (grey lines, equation (3.6)) and for the genotypic model (equation (3.12)) is plotted versus the mutation effect size, σ. Again the rescue probability is reduced in the genotypic model, but retains the overall behaviour of the phenotypic model. In (b), note that the magnitude of each mutation vector is not rescaled as N varies; the average magnitude thus increases with N for a fixed σ. This explains the left shift in the optimal value of σ for higher N. Filled circles are simulation results (error bars are similar to or smaller than symbol heights and have been omitted). Other parameters are: N = 5 (a), δ = 0.2 (b), U = 10−3, ρ = 1 and L = 15.

