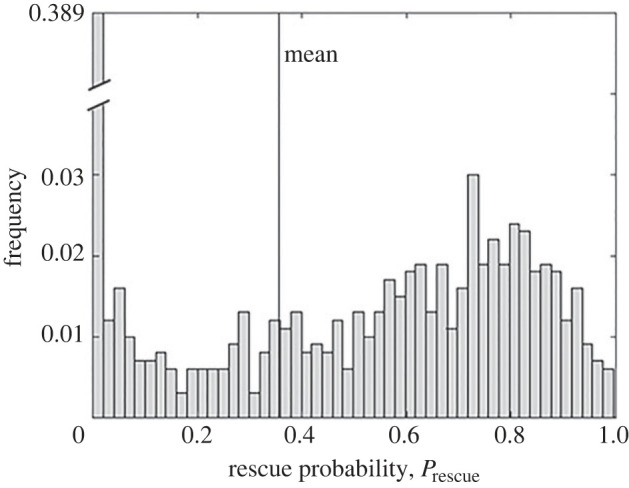
Figure 6.

Distribution of rescue probabilities across 1000 distinct draws of the mutational vectors, with the rescue scenario simulated 1000 times per set. The mean rescue probability was 0.355 (vertical line) with standard deviation 0.349. Note that the y-scale is broken for clarity. The parameters values are: σ = 0.2, L = 10, N = 5, δ = 0.2 and ρ = 1.
