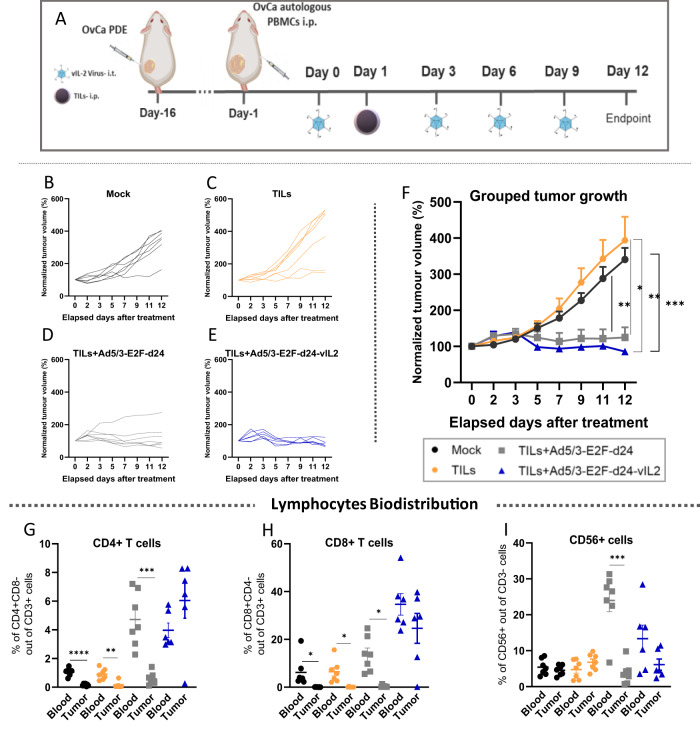
Fig. 4. Evaluation of vIL-2 virus plus TILs therapy efficacy in an ovarian cancer PDX tumor model.
Patient-derived ovarian cancer cells were engrafted (3.5 × 10⁶ cells/animal) in the left lower flank of immunocompromised female NOD.Cg-PrkdcscidIl2rgtm1Sug/JicTac mice. On day 15, when tumors reached ~5–6 mm, animals were randomized into one of the treatment groups (5–7 animals/group) and were humanized with OvCa patient-derived autologous expanded PBMCs, 5.0 × 10⁶ cells/animal. Subsequently, virus treatments with Ad5/3-E2F-d24 or Ad5/3-E2F-d24-vIL2 virus were given (1×10⁹ vp/tumor) via intratumoral injection on days 0, 3, 6, and 9 to the animals. On day 1, treatment groups received a single OvCa patient-derived TILs via intraperitoneal injection, 8.5 × 10⁶ cells/animal. A mock control group was included in the experiment and animals were humanized with pbmcs only similarly to the other groups. TILs monotherapy and mock groups were further injected intratumorally with PBS to match the tumor disruption promoted by the local virus treatments. Tumor development was assessed every two days with a digital caliper until day 12, when all animals were dispatched and tumors, blood, and selected organs were collected. A Schematic of the animal OvCa PDX model experiment layout. Normalized tumor volume represented as individual curves over experiment time across the experimental groups: B mock, C autologous TILs monotherapy, D TILs plus Ad5/3-E2F-d24 virus, and E TILs plus Ad5/3-E2F-d24-vIL2 virus. F Combined tumor progression in response to therapies. Biodistribution analyses by flow cytometry of (G) CD4+ T cells, (H) CD8+ T cells, and (I) CD56+ cells percentage levels in mice´s blood and tumors. Combined tumor growth statistical significance was analysed by two-way ANOVA and bar graphs by unpaired T test with Welch’s correction and presented as mean +− SEM. *p < 0.05, **p < 0.01, ***p < 0.001, ****p < 0.0001.

