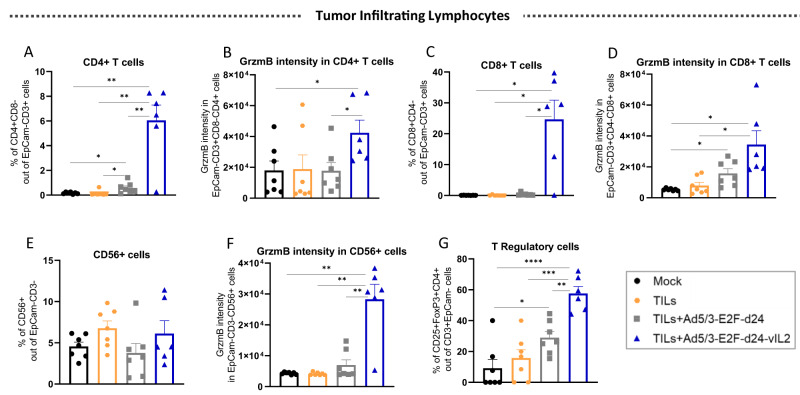
Fig. 5. Overview on the tumor infiltrating lymphocytes status after combination therapy treatment in vivo.
Tumors were collected on day 12, processed into single-cell suspensions, and stained for flow cytometry analyses. A Percentage of CD4+ T cells in tumors. B Granzyme B MFI in CD4+ T cells. C Percentage of CD8+ T cells. D Granzyme B intensity in CD8+ T cells. E Percentage of CD56+ cells. F Granzyme B intensity in CD56+ cells. G Levels of T Regulatory cells infiltrating OvCa PDX tumors. Data sets were analysed for statistical significance by unpaired T test with Welch’s correction and presented as mean +− SEM. *p < 0.05, **p < 0.01, ***p < 0.001, ****p < 0.0001.

