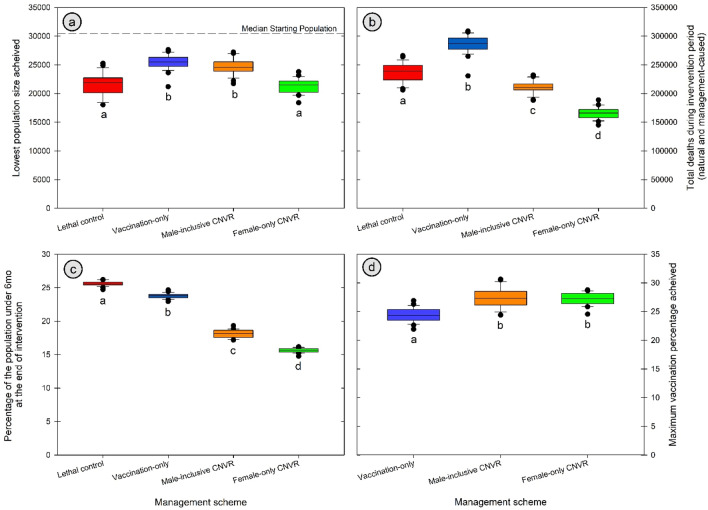
Figure 2.
(A) The lowest lagging mean dog population that was achieved by the four intervention strategies, all other parameters being equivalent (300 dogs caught per month and identical population dynamics). Significant groupings are denoted by matching letters. For vaccination-only, this decline is only caused by random variation in yearly population size and is not driven by any population control. The dotted line shows a the normal population average. (B) The overall number of dogs that died (by natural or intervention-related means) during the 10 years of each model’s intervention period. Significant groupings are denoted by matching letters. (C) The percentage of the population that was under 6 months of age) at the end of each model’s 10-year intervention period. Significant groupings are denoted by matching letters. (D) Boxplot data shows the highest percentage of dogs that had an immunologically protective vaccination status between each relevant management strategy (all using vaccine with 36-month immunity duration). Significant groupings are denoted by matching letters for vaccination percentage. Bar data shows the mean (and standard deviation) of dog population sizes at the time the maximum vaccination percentage was achieved.

