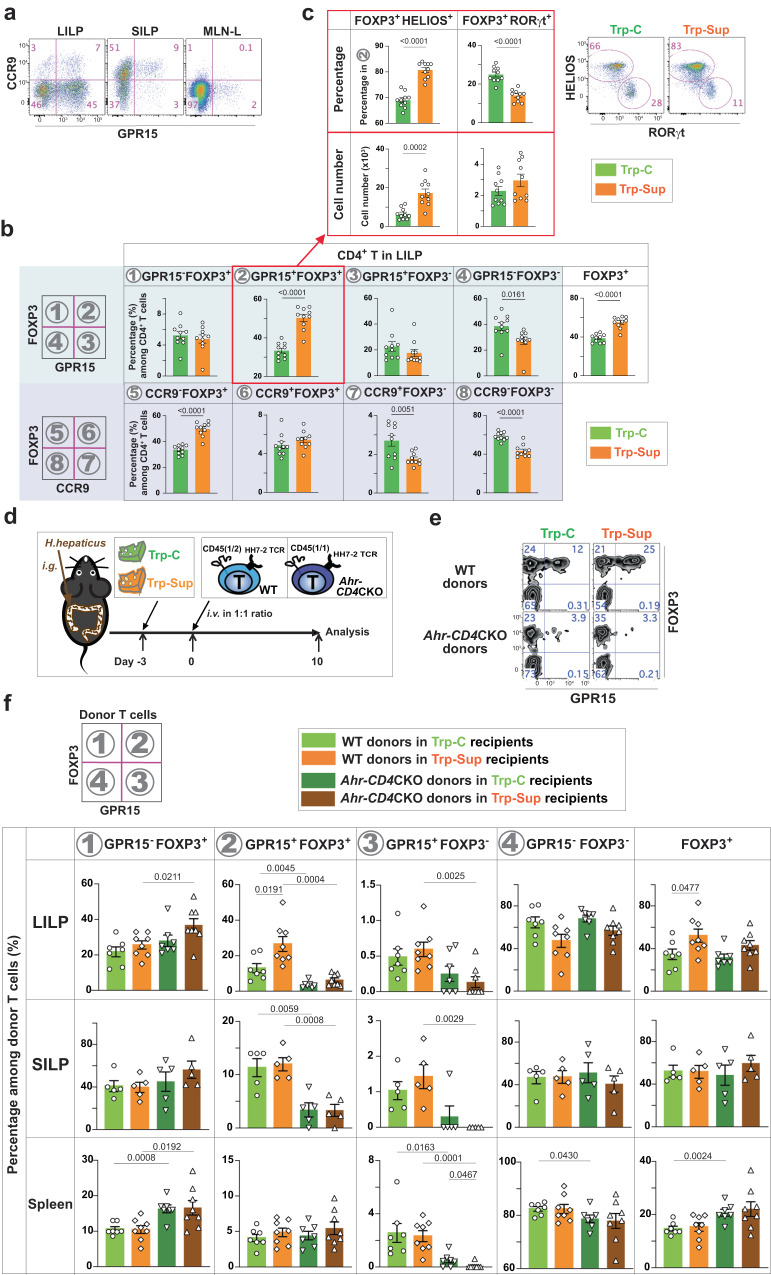
Fig. 2. L-Trp supplementation increases GPR15 expression via AhR during CD4+ T cell activation and their migration to the large intestine.
a Representative flow cytometry plot of CD4+ T cells in the LILP, SILP, and mesenteric lymph nodes-draining the proximal and mid-colon (MLN-L) in wild-type (WT) mice from JAX. b CD4+ T cells in the LILP, SILP, and MLN-L of WT mice from JAX with 8–12 weeks of age were analyzed for GPR15 (in the light blue shade) or CCR9 expression (in the light purple shade) in addition to FOXP3 expression after elementary diet treatment. The number of mice used: 10 for Trp-C and 10 for Trp-Sup. c GPR15+ Treg cells in the LILP in b were analyzed for HELIOS and RORγt expression. Trp-C (n = 10), Trp-Sup (n = 10). Combined results of two independent experiments and representative flow cytometry plots (b, c). d–f WT mice (JAX) were gavaged with H. hepaticus and treated with Trp-C or Trp-Sup elementary diets. After 3 days of elementary diets, recipient mice were transferred intravenously with 1:1 mixture of 104 naive CD4+ T cells from two different mice (WT: HH7-2TgRag1(n/n)Ahr(fl/fl)CD45(1/2); Ahr-CD4CKO: HH7-2Tg Rag1(n/n)CD4creAhr(fl/fl)CD45(1/1)) and analyzed 10 days later. d Schematic plan. e Representative flow cytometry plots of donor cells in the LILP. f The percentages of different populations among total donor T cells are shown. Data are presented as mean values ± SEM. The number of mice used: n = 7 for LILP, n = 5 for SILP, n = 7 for spleen for recipients treated with Trp-C; n = 8 for LILP, n = 5 for SILP, n = 8 for spleen for recipients treated with Trp-Sup. Representative of two independent experiments. 8–12-week-old mice were used (a–c, e, f). Data are presented as mean values ± SEM (b, c, f). Each data point represents the result from one mouse, and p values were calculated by two-sided student’s t-test (b, c, f). Source data are provided as a Source Data file (b, c, f).

