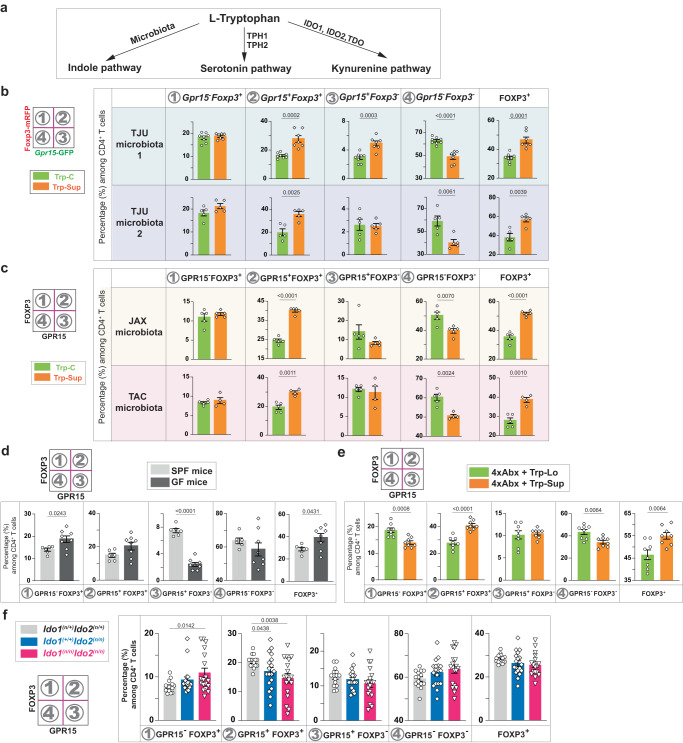
Fig. 3. The default response to L-Trp is a selective increase of GPR15+ Treg cells via host IDO1/2 enzymes in a microbiota-independent manner.
a. L-Trp metabolic pathways upon ingestion. b-f. Percentages of each population among CD4+ T cells in the LILP based on Gpr15-GFP and Foxp3-mRFP expression (b) or GPR15 and FOXP3 expression (c–f). b, c Wild-type (WT) mice (Gpr15(gfp/+)Foxp3mrfp) with Thomas Jefferson University (TJU) microbiota (two different microbiota: TJU1 or TJU2) (b), or WT mice with Jackson laboratory microbiota (JAX) or Taconic Biosciences microbiota (TAC) (c) were treated with Trp-C or Trp-Sup elementary diets for 2 wks. The number of mice used (n): 8 for TJU1 (Trp-C), 7 for TJU1 (Trp-Sup), 5 each for TJU2 (Trp-C and Trp-Sup), 5 each for JAX (Trp-C and Trp-Sup), 5 for TAC (Trp-C), 4 for TAC (Trp-Sup). d Specific pathogen-free (SPF) mice (TAC, n = 6) and germ-free mice (n = 8) were compared at a steady state. e WT mice with JAX microbiota were treated with four different antibiotics (4xAbx) in drinking water for four weeks. Elementary diets (Trp-Lo (n = 8) or Trp-Sup (n = 8)) were provided for two weeks in the presence of 4xAbx. Representatives of two independent experiments (b, c, e). f Ido1/2(n/+), Ido2(n/n), and Ido1/2(n/n) mice were analyzed at a steady state. Combined results of five independent experiments. The number of mice used: 15 for Ido1/2(n/+), 18 for Ido2(n/n), 18 for Ido1/2(n/n). 8–14-week-old mice were used (b-f). Data are presented as mean values ± SEM (b–f). Each data point represents the result from one mouse, and p values were calculated by two-sided student’s t-test (b–f). Source data are provided as a Source Data file (b–f).

