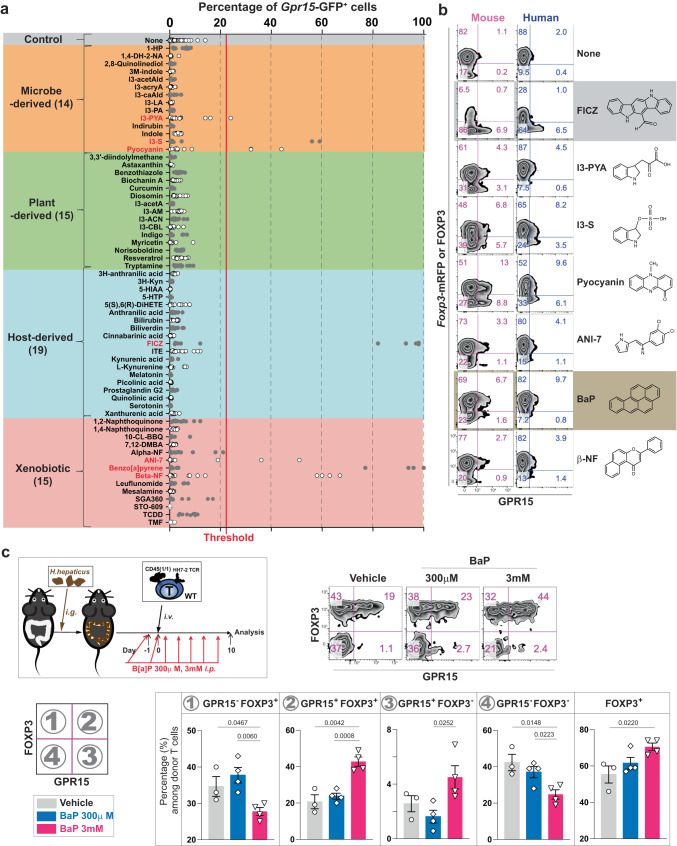
Fig. 4. The identity of AhR ligand determines the T cell types expressing GPR15.
a Chemical compounds with known AhR ligand activity (Table S2) were categorized based on their origin and tested on CD4+ naive T cells from Gpr15(gfp/+)Foxp3mrfp mice. The red vertical line is set as a threshold for further analysis. Seven compounds (labeled red) induced a GFP signal above the threshold. b Compounds shown to induce GPR15 expression in Fig. 4a were tested with mouse and human CD4+ T cells for GPR15 and FOXP3 protein expression. Representative flow cytometry plots of at least three independent experiments. c Wild-type mice (JAX) were gavaged and injected intraperitoneally with 300 μl of either PBS (n = 3) or 300 μM (n = 4) or 3 mM (n = 4) of BaP 7 times. GPR15 and FOXP3 expression of T cells with HH7-2 TCRs were analyzed on day 10. The percentage of each population in CD4+ donor T cells in the LILP is shown. Representative of two independent experiments. Data are presented as mean values±SEM (c). Each data point represents the result from one mouse, and p values were calculated by two-sided student’s t-test (c). 8-14-week-old mice were used (a–c). Source data are provided as a Source Data file (a, c).

