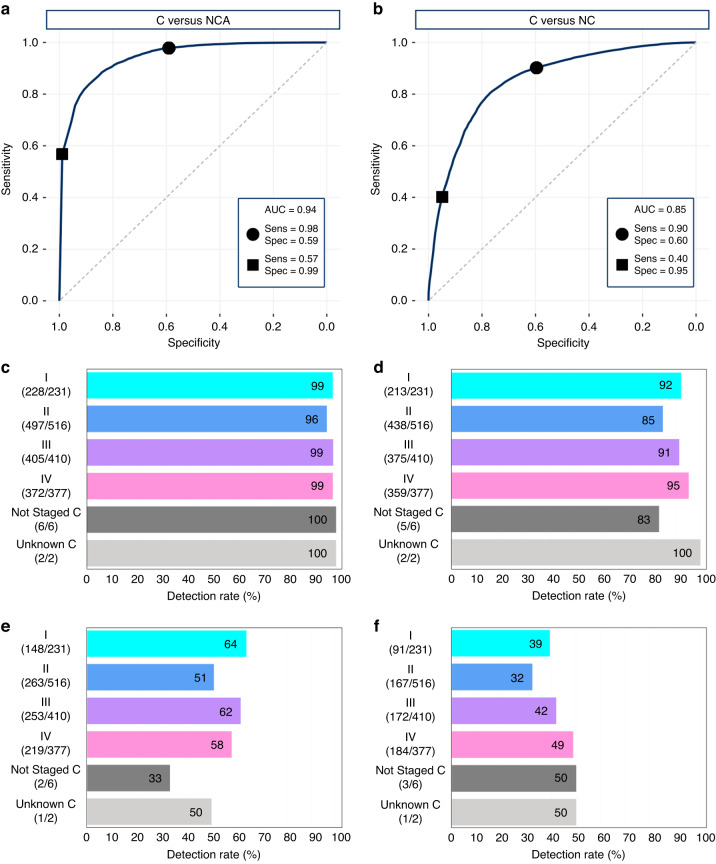
Fig. 3. Results from the cancer (C) versus asymptomatic non-cancer (NCA) classification and the C versus all non-cancer (NC) classification.
The mean receiver operating characteristic curve for a C versus NCA and b C versus NC showing the trade-off between sensitivity (Sens) and specificity (Spec), where the markers represent the sensitivity-tuned model (●), and specificity-tuned model (■), and AUC denotes the area under the curve. The detection rates for the sensitivity-tuned models c, d and the specificity-tuned models e, f are illustrated for the respective classifications, split by cancer stage.

