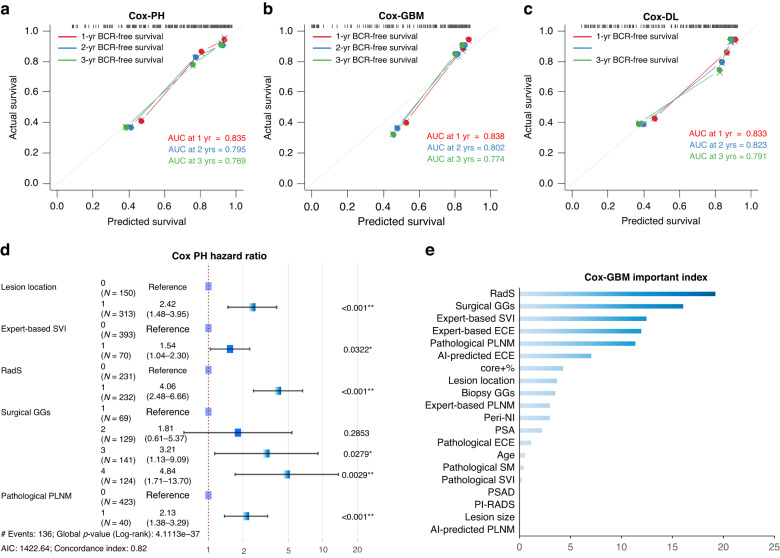
Fig. 3. Results of baseline iBCR-Net M0 using Cox-PH, Cox-GBM and Cox-DL.
Calibration curve plot of predicted vs observed BCR-free survival rates and time-dependent area-under-the-curve (AUC) at 1-year, 2-year and 3-year endpoint (a–c). Forest plots of hazard ratio and importance index of multimodal factors for BCR at Cox-PH (d) and Cox-GBM (e).

