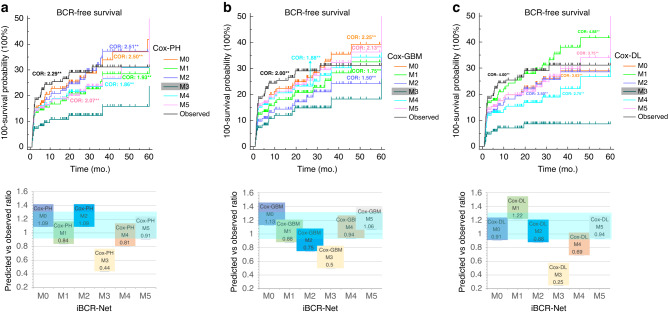
Fig. 4. Plots of predicted vs observed BCR-free survival curves.
There is no significant (p > 0.05 at the pairwise log-rank test) of predicted survival rates by M0, M1, M2, M4, M5 using Cox-PH (a), Cox-GBM (b) and Cox-DL (c) against true observations. There is a significant (**, p < 0.01 at the pairwise log-rank test) difference in predicted survival rates by M3 compared to those by M0, M1, M2, M4, M5 and true observations. Cross-odds ratio (COR) indicates the relative benefit of the desired model against M3 for survival prediction (e.g., in the upper row, a COR of 2.5 for desired M0 against M3 implicates the use of M0 results in 2.5-fold odds compared to M3 for predicting BCR survival). Plot of the ratio between prediction and observation (lower row) indicates relative agreement between prediction and observation, in which a ratio of 1:1 indicates fully consistent, and <0.8 or >1.2 suggests significant prediction deviation.

