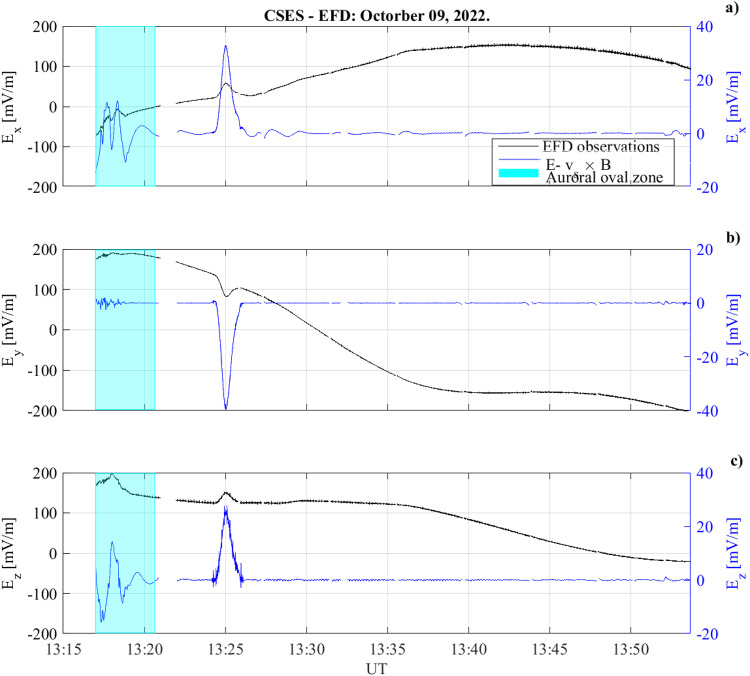
Fig. 4. Ionospheric Electric field observations from CSES satellite.
CSES electric field waveform as function of time during the GRB221009A occurrence for the three components Ex (panel a), Ey (panel b) and Ez (panel c) with (black curve) and without (blue curve) the vs × B induced electric field component. The blue-shaded region corresponds to the CSES flight over the Auroral Region. The CSES electric field observations were measured at an altitude of 507 km.

