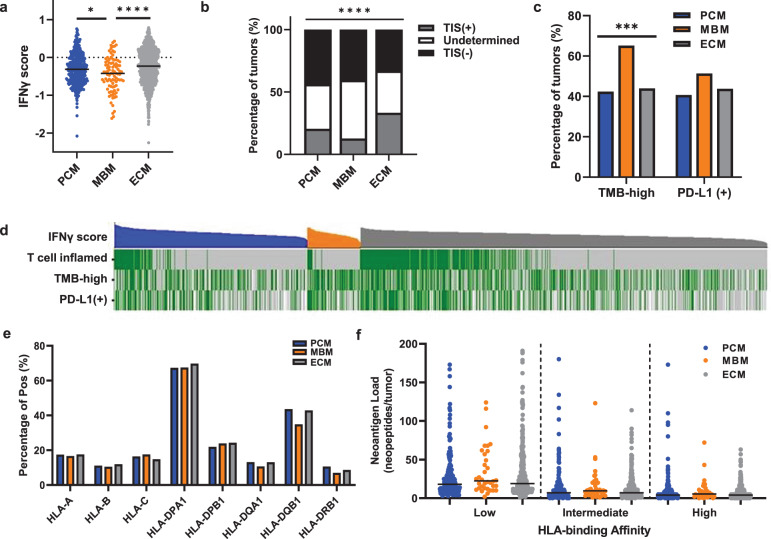
Fig. 1. MBM with comparable HLA homozygosity and neoantigen load are less immunogenic than PCM or ECM.
a IFNγ scores for PCM (blue, n = 350), MBM (orange, n = 94) and ECM (gray, n = 870). Black lines indicate median IFNγ score values. Kruskal–Wallis test with Benjamini-Hochberg correction; ****, corrected p < 0.0001; *, corrected p < 0.05. b PCM, MBM, and ECM were evaluated and classified by T cell-inflamed signature. The percentages of tumors with T cell-inflamed signatures (TIS(+); gray), undetermined (white), and lacking a T cell-inflamed signature (TIS(-); black). Chi-square test; ****p < 0.0001. c The percentage of PCM (n = 276), MBM (n = 72), and ECM (n = 681) that are TMB-high and PD-L1(+). Chi-square test; ***, p < 0.0005. d Oncoplot including IFNγ scores (top, highest to lowest within PCM, blue; MBM, orange; ECM, gray), T cell-inflamed signature (green, T cell-inflamed tumors; gray, others), TMB (high, green; low, gray; white, data not available) and PD-L1 IHC staining (positive, green; negative, gray; white, data not available). e Percentage of tumors that are homozygous at HLA-I (HLA-A, HLA-B, and HLA-C) and HLA-II (HLA-DPA1, HLA-DPB1, HLA-DQB1, and HLA-DRB1) loci in PCM, MBM, and ECM. Chi-square test, not significant (p > 0.05). f Assessment of neoantigen load with low (left), intermediate (middle), and high (right) HLA-binding affinity for PCM (blue), MBM (orange), and ECM (gray). Kruskal–Wallis test; not significant (p > 0.05).

