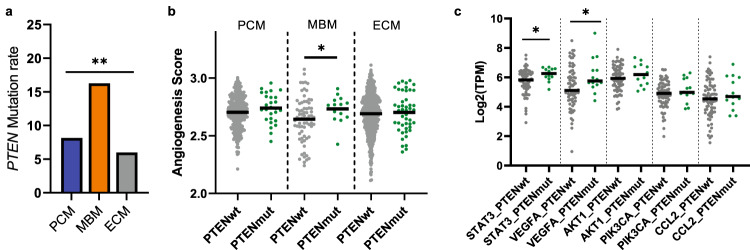
Fig. 3. Association of angiogenic factors with PTEN mutations in MBM.
a The percentage of PCM (blue, n = 332), MBM (orange, n = 86), and ECM (gray, n = 801) with PTEN mutations. Chi-square test; **p < 0.005. b ssGSEA analysis for normalized enrichment scores (NES) of hallmark angiogenesis pathway comparing tumors with PTEN mutations (green) and without PTEN mutations (gray) within PCM, MBM, and ECM groups. Black line indicates median. Mann-Whitney test; *p < 0.05. c The mRNA levels of key regulatory genes (STAT3, VEGFA, AKT1, PIK3CA, and CCL2) in the angiogenesis pathway were cross compared between MBM tumors with PTEN mutations (green) and without PTEN mutations (gray). Black line indicates median. Mann-Whitney test; *p < 0.05.

