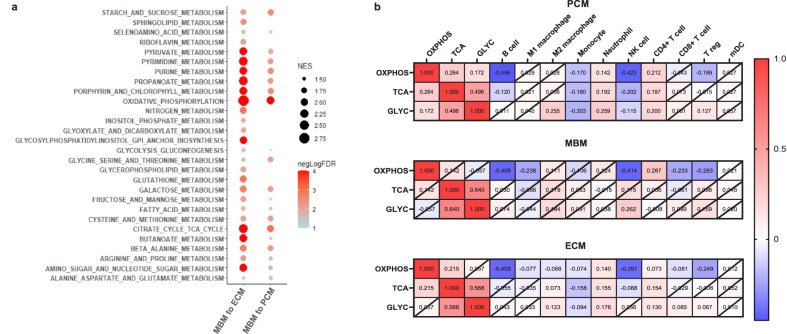
Fig. 5. MBM show enrichment in oxidative phosphorylation, TCA cycle, and glycolysis gluconeogenesis pathways.
a GSEA analysis demonstrates a significant enrichment in of KEGG metabolic pathways in MBM versus PCM (left lane) or ECM (right lane). The normalized enrichment score (NES) is indicated by the size of the dot and the -log10 p value (cut off FDR < 0.05) is indicated by the color of the dot. b Heat maps of Spearman rank correlations between NES of OXPHOS, TCA cycle (TCA), and glycolysis (GLYC) determined from ssGSEA and computationally inferred immune cell abundance in PCM, MBM, and ECM. The numbers in each box show the correlation coefficient, where crossed boxes indicate non-significant correlation values (p > 0.05).

