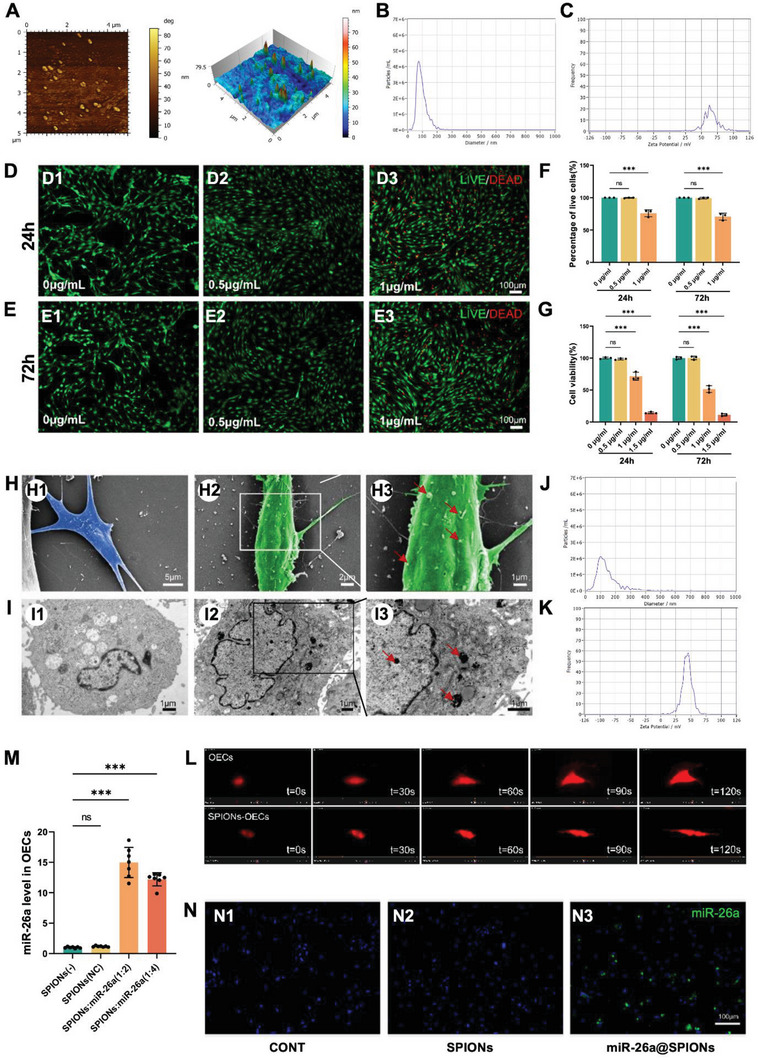
Figure 1.

The characteristics of miR‐26a@SPIONs‐OECs. A) Atomistic microscopy images and 3D surface view of SPIONs. B) Representative nanoparticle analysis of the size distribution of SPIONs. C) Zeta potential of PEI‐SPIONs. Staining images of the LIVE/DEAD assay at 24 h D) and 72 h E) after transfection of OECs with different concentrations of SPIONs. F) The percentage of live cells was measured via the LIVE/DEAD assay. Live cells were stained green, while dead cells were stained red (n = 3, ***p < 0.001 for comparison with OECs without treatment). G) Cell viability was estimated using the CCK‐8 assay (n = 3, ***p < 0.001 for comparison with OECs without treatment). H)Representative SEM images of normal control OECs (H1) and OECs magnetofected with 0.5 µg mL−1 SPIONs for 24 h (H2). (H3) High magnification of the boxed area in (H2), The red arrows point to SPION agglomerates on the cell membrane. I) Representative TEM images of normal control OECs (I1) and OECs magnetofected with 0.5 µg mL−1 SPIONs for 24 h (I2). (I3) High magnification of the boxed area in (I2). The red arrows point to SPIONs in the cytoplasm; most retained SPIONs are dispersed as single particles. J) Overall distribution of miR‐26a@SPIONs complex sizes. K) Zeta potential of the miR‐26a@SPIONscomplex. L) Time‐series live imaging of OECs transfected with lentivirusmCherry in CONT and SPIONs‐OECs group under the MF. M) At 72 h after magnetofection, miR‐26a levels in each group (normalized to normal control OECs) (n = 7, ***p < 0.001 for comparison with OECs without treatment). N) Representative in situ hybridization results of miR‐26a in OECs of different treatment groups. All statistical data were analyzed by one‐way ANOVA with Dunnett's multiple comparisons test and represented as mean ± SD, CONT = the control group, ns = no significance.
