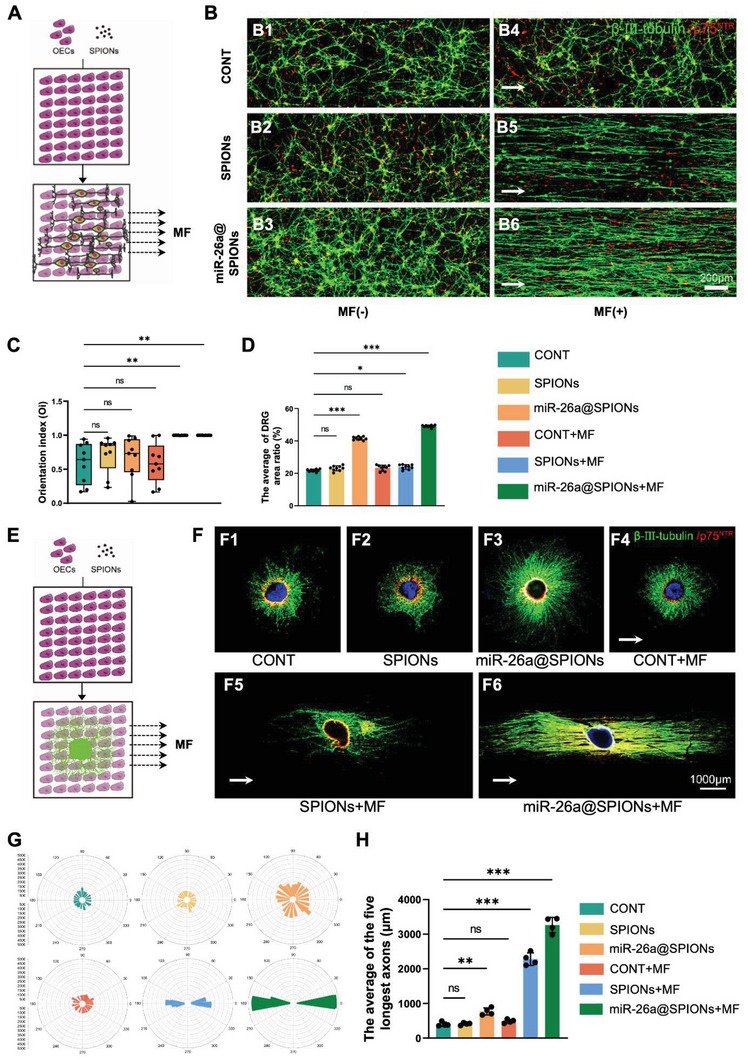
Figure 4.

Directional growth of DRG in co‐culture with OECs. A)Schematic diagram of the growth of DRG neurons in neurons on the OECs layer; B) Immunofluorescence staining of the directed growth of DRG neurons in different treatment groups; OECs specifically expresses p75NTR (red), and DRG neuron specifically expresses β‐III‐tubulin (green); C) DRGs migration orientation index. The box plot showed the median, interquartile ranges, maximum, and minimum (n = 9, **p < 0.01 for comparison with OECs without treatment). D) The average DRG area ratio (n = 9, *p < 0.05 and ***p < 0.001 for comparison with OECs without treatment). E) DRG explants on the OECs layer growth diagram; F)Immunofluorescence staining of DRG explants growth in different treatment groups, specific expression of p75NTR by OECs (red), β‐III‐tubulin specific expression by DRG neurons (green), and the nucleus is stained with DAPI (blue); G) Statistical maps of DRG explants orientation in different treatment groups; H) Statistical diagram of the average length of the longest 5 axons of DRG explants in different treatment groups (n = 4, **p < 0.01 and ***p < 0.001 for comparison with OECs without treatment). All statistical data were analyzed by one‐way ANOVA with Dunnett's multiple comparisons test and represented as mean ± SD, CONT = the control group, ns = no significance.
