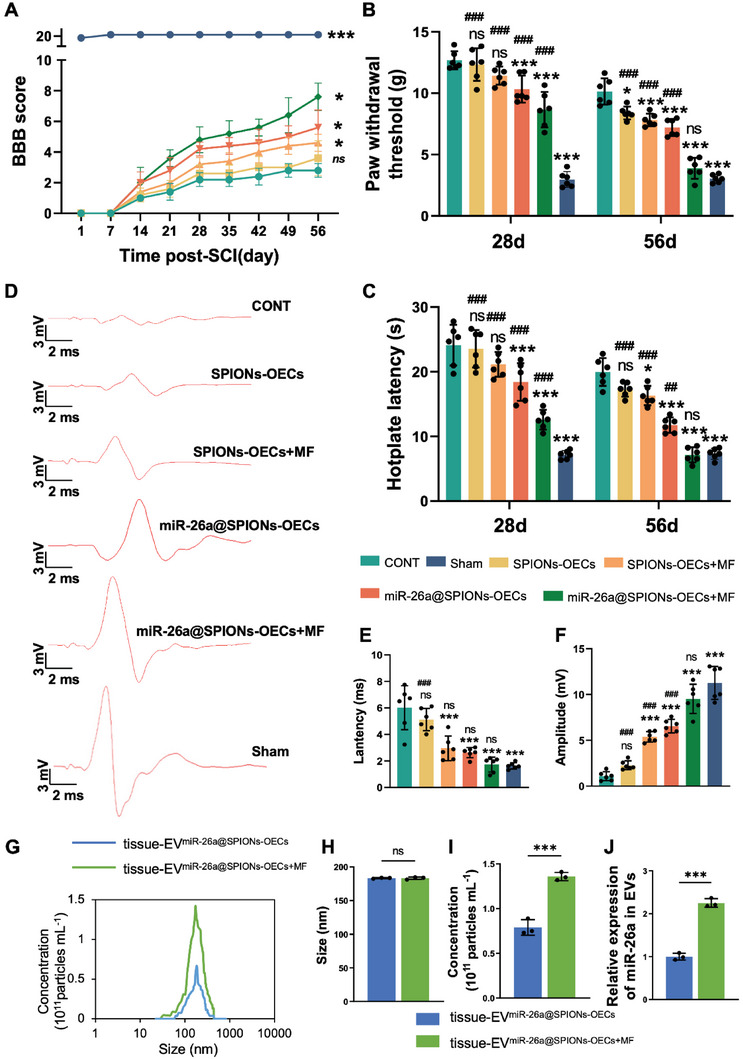
Figure 8.

Motor functional recovery of SCI rats after treatment with the miR‐26a@SPIONs‐OECs under MF. A) Basso, Beattie & Bresnahan locomotor rating scale of hindlimbs of mice from different groups during the 8‐week treatment periods (n = 5, *p < 0.05 and ***p < 0.001 for comparison with OECs without treatment). B) The paw withdrawal threshold of CONT, Sham, SPIONs‐OECs, SPIONs‐OECs+MF, miR‐26a@SPIONs and miR‐26a@SPIONs+MF (n = 6, *p < 0.05 and ***p < 0.001 for comparison with OECs without treatment; ###p < 0.001 for comparison with miR‐26a@SPIONs‐OECs+MF). C) The Hotplate latency of CONT, Sham, SPIONs‐OECs, SPIONs‐OECs+MF, miR‐26a@SPIONs and miR‐26a@SPIONs+MF (n = 6, *P < 0.05 and ***P < 0.001 for comparison with OECs without treatment; ##p < 0.01 and ###p < 0.001 for comparison with miR‐26a@SPIONs‐OECs+MF). D) Representative images of MEPs 28 days and 56 days post‐surgery. E)The latency of MEPs (n = 6, ***p < 0.001 for comparison with OECs without treatment; ###p < 0.001 for comparison with miR‐26a@SPIONs‐OECs+MF). F)The peak amplitude of MEPs (n = 6, ***p < 0.001 for comparison with OECs without treatment; ###p < 0.001 for comparison with miR‐26a@SPIONs‐OECs+MF). G)The overall distribution of tissue‐EVmiR‐26a@SPIONs‐OECs and tissue‐EVmiR‐26a@SPIONs‐OECs+MF from the spinal cord. Size H) and quantification I) analyses of tissue‐EVmiR‐26a@SPIONs‐OECs and tissue‐EVmiR‐26a@SPIONs‐OECs+MF by NTA (n = 3, ***p < 0.001 for comparison with EVmiR‐26a@SPIONs‐OECs). J) Detection of miR‐26a content in EVs by qPCR (n = 3, ***p < 0.001 for comparison with EVmiR‐26a@SPIONs‐OECs). A–C) and (E,F) were analyzed by one‐way ANOVA with Dunnett's multiple comparisons test and H–J) were analyzed by Student's t‐test. All statistical data were represented as mean ± SD, CONT = the control group, ns = no significance.
