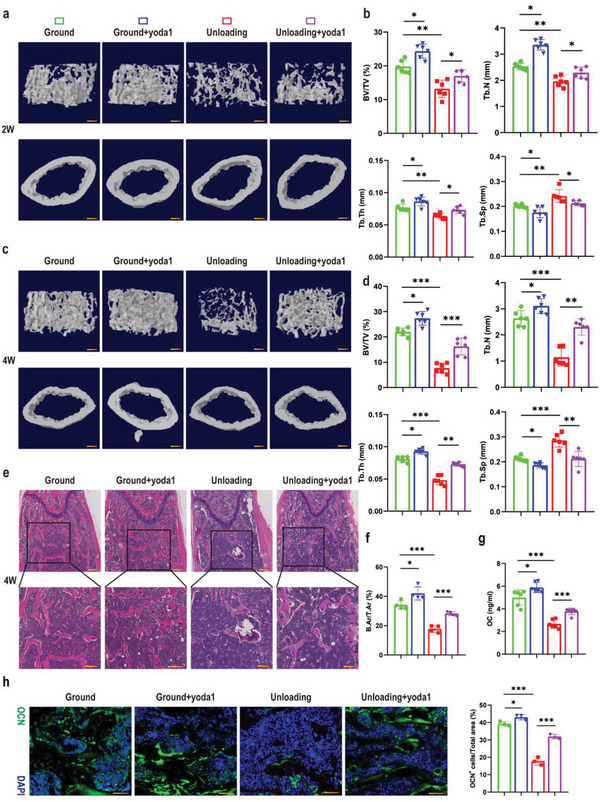
Figure 2.

Activation of Piezo1 rescued bone loss under simulated microgravity. a) Representative 3D trabecular architecture and cortical bone images based on micro‐CT reconstruction of the distal femurs at week 2 post‐hindlimb unloading. Scale bar = 500 µm. b) Comparative analysis of the bone parameters including trabecular bone volume fraction (BV/TV), trabecular number (TB. N), trabecular thickness (TB.TH) and trabecular separation (TB. SP) from the distal femurs in the indicated mice at week 2. Mean ± SD, n = 6 in each group. *p < 0.05, **p < 0.01, ***p < 0.001. c) Representative 3D trabecular architecture and cortical bone images based on micro‐CT reconstruction in the distal femurs at week 4 post‐hindlimb unloading. Scale bar = 500 µm. d) Comparative analysis of the bone parameters including trabecular bone volume fraction (BV/TV), trabecular number (TB.N), trabecular thickness (TB.TH) and trabecular separation (TB.SP) from the distal femurs in the indicated mice at week 4. Mean ± SD, n = 6 in each group. *p < 0.05, **p < 0.01, ***p < 0.001. e) Representative H&E staining images of distal femurs in the indicated mice at week 4. Magnified images of the boxed areas are shown in the panel below. Scale bar = 500 µm (upper image); 100 µm (lower image). f) Quantitative analysis of B.Ar/T.Ar of distal femurs at week 4. Mean ± SD, n = 4 in each group. *p < 0.05, ***p < 0.001. B.Ar = bone area; T.Ar = total area; g) Serum OC levels in the indicated mice analyzed by ELISA at week 4. Mean ± SD, n = 6 in each group. *p < 0.05, ***p < 0.001. h) Representative immunofluorescent images showing OCN (green) on sections of distal femurs at week 4 post‐hindlimb unloading. Scale bar = 50 µm. The percentage of OCN‐positive cells was calculated. Mean ± SD, n = 3 in each group. *p < 0.05, ***p < 0.001. OCN = osteocalcin.
